Is STS right for me? Who our NQ signals are not for
Short answer. STS fits traders who can lose more trades than they win, sit through losing months, and fund the signals in MNQ micro contracts: we recommend $16,000, and about $7,000 is the floor that survives a 1-in-20 reshuffled drawdown. It is not for you if most of your trades must win or you need income every month. In our hypothetical backtest 54.5% of 3,500 trades lost, 62 of 179 full months lost money, and the largest dollar drawdown, $51,836 on the 1 to 3 contract book, was also the most recent (June 15 to July 20, 2026).
STS is built for a patient trader: one who accepts more losing trades than winning ones, judges results over years, and places each order by hand. This page sets out nine fit tests, each with what STS is built for, the backtest number behind it and what it means for you, so you can rule yourself in or out before you pay.
Every figure comes from our backtest of the five-strategy NQ book (five strategies traded as one account), August 2011 to August 5, 2026. Backtest results are hypothetical. Dollar figures are for the 1 to 3 contract NQ mini book, sized by volatility. Micro scale means the same signals in MNQ at 1 to 3 contracts (average 1.81), which is every dollar times 0.1.
Who should not subscribe to STS?
Anyone who needs most trades to win or income every month, cannot fund about $7,000 for MNQ micro contracts, wants the trades placed for them, or needs a long live record.
1. You need most trades to win
Fit test. STS is built to be paid by the size of its winners, not by how often it wins. Not a fit if you need to win more trades than you lose.
The number. In the backtest the book won 45.5% of its 3,500 trades, so 1,909 trades lost money. In 14 of 16 calendar years, fewer than half of its trades won.
What it means for you. The profit came from the size of the winners: $1,979 on average against $1,067 for the average loser, a payoff ratio (average win divided by average loss) of 1.86. Expect to be wrong more often than right.
2. You cannot sit through 14 losses in a row
Fit test. STS is built for traders who keep following the rules through a losing run. Not a fit if a long losing run would make you stop following the signals.
The number. The worst backtested losing streak was 14 trades in a row, from August 26 to September 30, 2015, and it cost $7,412. The largest single loss was $15,628, or $1,563 at micro scale, on July 17, 2026.
What it means for you. Decide before you start what you will do on the tenth loss in a row; the backtest had 3 runs of 10 or more losses in 15 years. The full run is in our worst losing streak.
3. You need income every month
Fit test. STS is built for money you can leave in the account through losing months. Not a fit if you need the account to pay you every month.
The number. 62 of 179 full backtested months (34.6%) lost money in book dollars. The longest losing run was 5 months, January to May 2013. Calendar years 2011, 2012 and 2013 all finished negative.
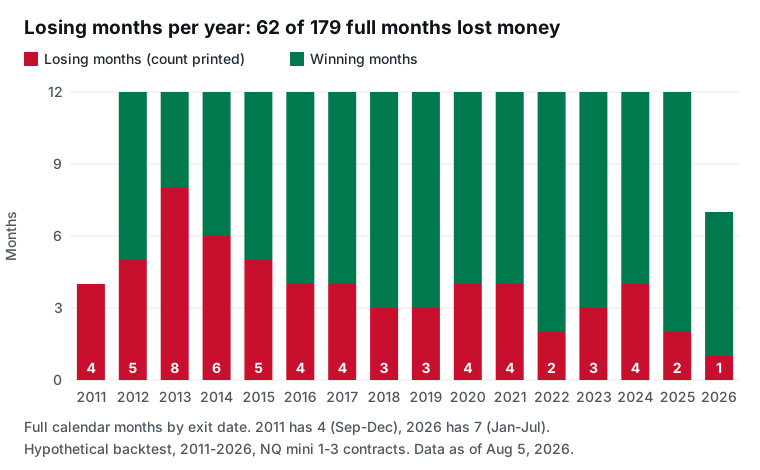
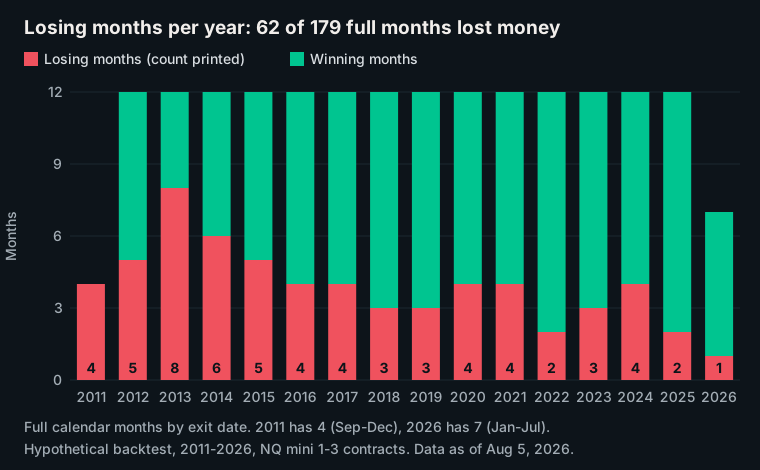
In dollars, the worst month was July 2026, down $12,340 across 17 backtest trades. Signals went live on July 6, partway through it; our first 30 days of live signals covers what they did.
What it means for you. If the account pays your bills, a losing month forces you out at the wrong time. STS is built for money that can stay in through a five-month losing run, the longest in the backtest.
4. You cannot fund at least $7,000 for MNQ
Fit test. STS is built for an account sized on its reshuffled drawdowns, with room to spare. Not a fit if you cannot fund about $7,000 to trade the signals at micro scale; we recommend $16,000.
The number. The largest backtested dollar drawdown (the drop from a previous equity high, counted on closed trades) was $51,836 on the 1 to 3 contract NQ mini book. It is also the most recent, from June 15 to July 20, 2026, and $41,110 of it (79%) came from backtest trades entered on or after July 6, the day signals went live.
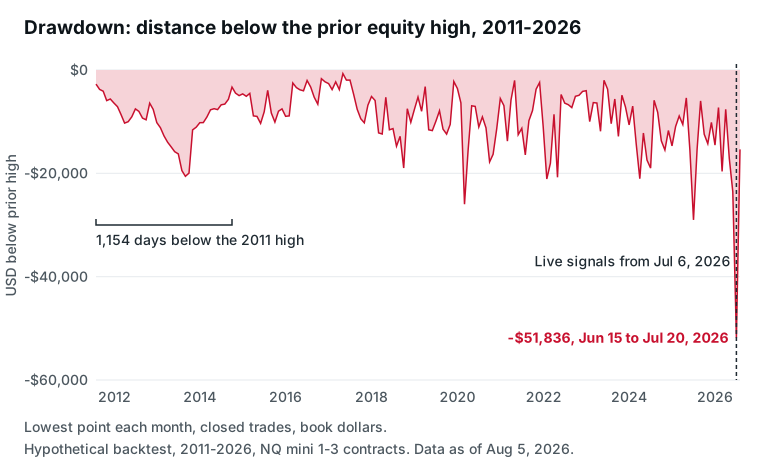
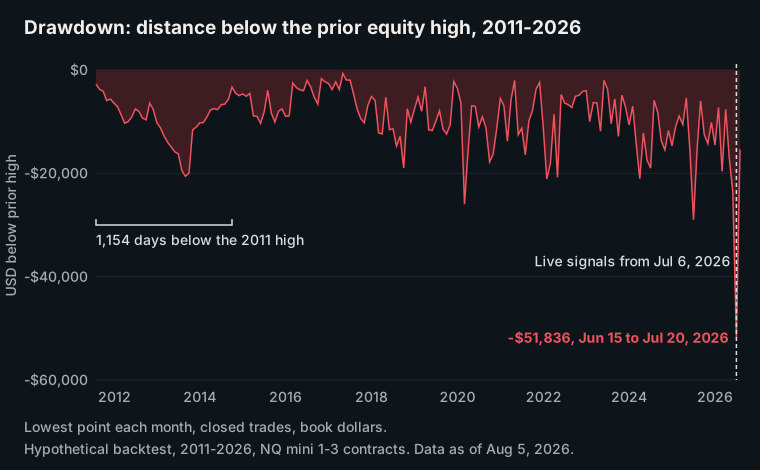
To separate luck from the trades, we reshuffled the same 3,500 trades into 10,000 random orders and measured each path's largest dollar drawdown. The real record drew down more than 72% of those paths. At mini scale, all 10,000 paths (100%) drew down more than $25,000, and 1 in 20 more than $67,838. The longest stretch below a prior high, 1,154 calendar days from 2011 to 2014, was longer than in any of the 10,000 reshuffles.
At micro scale the median reshuffled drawdown (the middle path) was $4,538. The 1-in-20 case was $6,784, and the real record's drawdown was $5,184.
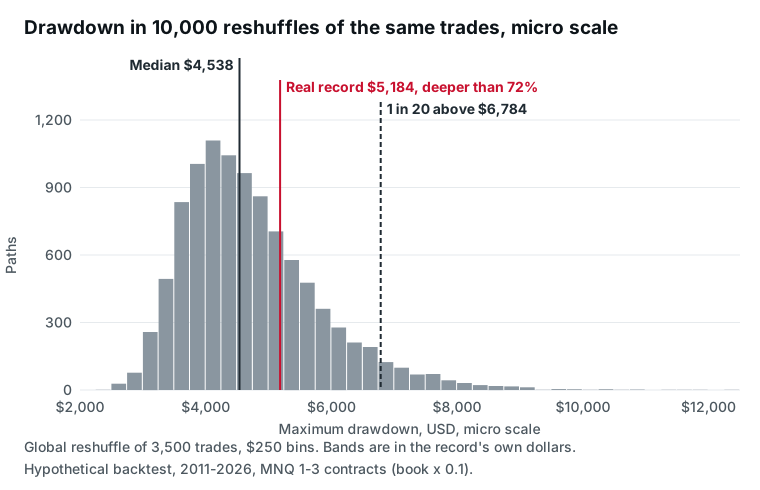
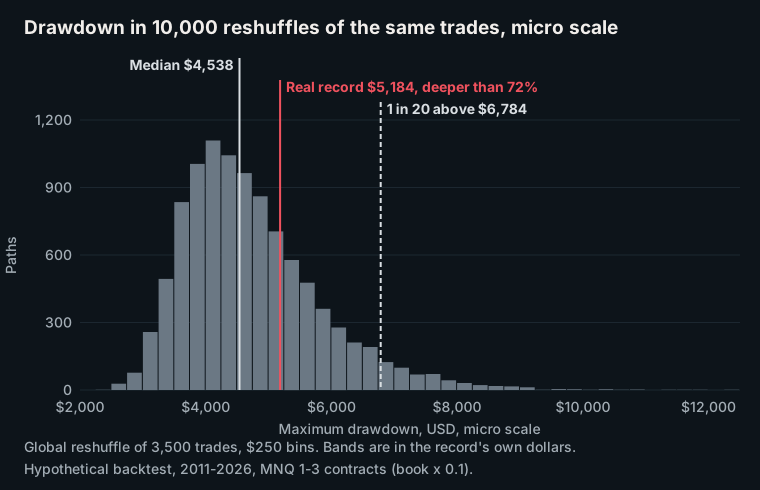
What it means for you. STS sizes both account figures on the reshuffled drawdowns, not on the one path the record happened to take, and both are in the record's own dollars. They do different jobs. About $7,000 at micro scale is the floor that survives a 1-in-20 drawdown: it covers the $6,784 1-in-20 case, the survival rule in our account size reality check. $16,000 at micro scale is the size the record supports with room to spare, 3.5 times the $4,538 median rounded up, and it is what STS recommends.
5. You need each month to cover the $50 fee
Fit test. STS is built to be judged on a year of results. Not a fit if every month's result at micro scale must pay for the subscription.
The number. At micro scale the backtest earned less than the $50 monthly fee in 70 of 179 full months (39.1%). From 2011 to 2018 that was 45 of 88 months (51.1%); from 2023 it was 11 of 43 (25.6%). The median full month at micro scale netted $218.
What it means for you. Judge the fee against a year of results. Dollar results scale with NQ's price, which rose about fourteenfold across the record, from 2,124 at the first entry to 30,052 at the last, so recent months are not a baseline for the next ones.
The price is $50 a month or $500 a year, with no free trial. You can cancel any time; payments already made are not refunded.
6. You want a trade every day
Fit test. STS is built to trade only when its rules fire, about four times a week. Not a fit if you want daily action.
The number. In the backtest the book opened 4.48 trades a week on average across 781 weeks, fewer than one per weekday. Around each quarterly contract roll (the switch to the next contract month) the book pauses new entries for the roll week, the Monday-to-Friday week containing the second Thursday of March, June, September and December: 43 of those 60 roll weeks had no new trade, against 2 of the other 721 weeks; each of the other 17 roll weeks had one trade, entered at the Sunday-evening reopen before the pause began.
What it means for you. Expect quiet days, and a silent week at most quarterly rolls. Week-by-week counts are in how often our NQ signals fire.
7. You want the trades placed for you
Fit test. STS is built for traders who place their own orders. Not a fit if you cannot place orders yourself during market hours.
The number. Every trade arrives as two alerts, an entry and an exit. 98.5% of the 7,000 backtest alerts fell between 8 a.m. and the 5 p.m. daily halt, or in the 6 p.m. hour when trading reopens, New York time.
In the backtest, 55.5% of entries fired in the first hour of the day session (9:30 to 10:30 a.m.) and 22.7% at the evening reopen; 35.4% of exits came in the last hour before the halt.
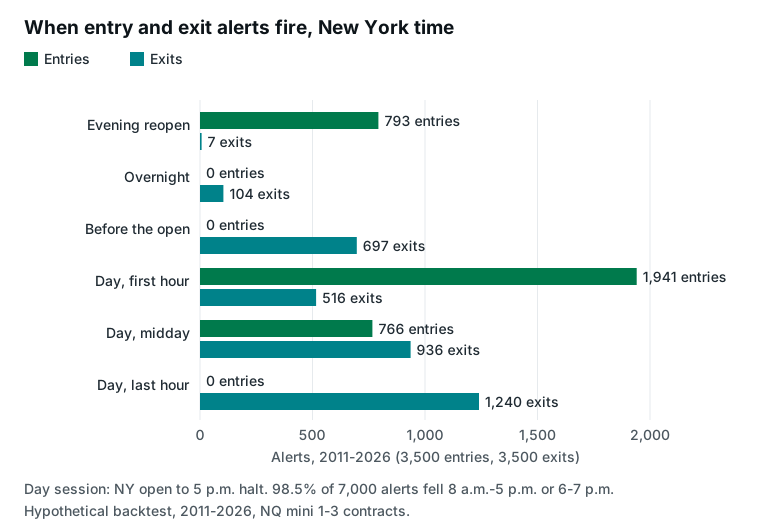
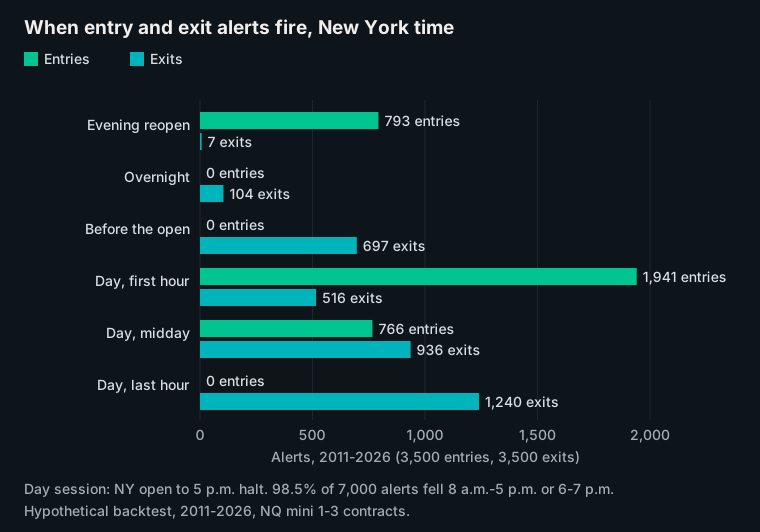
What it means for you. You place both orders yourself; there is no automation and no broker connection. Alerts arrive by email and on the dashboard's live feed, and each entry alert states the contract count, 1 to 3, which at micro scale you place in MNQ. To act on 98.5% of alerts, be reachable in those hours.
8. You want a market other than NQ
Fit test. STS is built for one market, the E-mini Nasdaq-100 (NQ). Not a fit if you want signals for other markets.
The number. All 3,500 trades are on NQ. 3,032 of 3,500 trades (86.6%) were longs, which profit when NQ rises, and 468 (13.4%) were shorts. In the backtest the book lost money in 7 of the first 10 NQ declines of 10% or more, then made money in all 4 since November 2021, and finished both NQ down years positive, including 2022 at $95,790.
What it means for you. Most trades are longs, so do not count on it as a hedge for long Nasdaq holdings. The focus is deliberate: when we ran the same system on ES, YM and RTY futures, only NQ passed.
9. You need a long live record
Fit test. STS is built to be checked as it goes: every live signal is dated and public on our forward record. Not a fit if you need years of live results before you subscribe.
The number. Signals have been live since July 6, 2026, a small fraction of a 15-year backtest. In the backtest, 44 of the 177 three-month stretches a subscriber could have started lost money (24.9%).
What it means for you. A few months of live results cannot confirm or refute the edge. The five strategies were chosen on this same history, so every figure here is in-sample (measured on the data used to pick them); is my backtest overfit covers how we test for that.
Who does STS fit, and what should you do next?
STS fits if you can:
- fund $16,000 at micro scale, the size we recommend, or at least about $7,000, the floor that covers a 1-in-20 reshuffled drawdown of $6,784;
- lose more trades than you win (54.5% lost);
- sit through 14 losses in a row ($7,412);
- trade NQ or MNQ only, about four times a week (4.48 on average);
- go 5 months in a row without a profit;
- be reachable from 8 a.m. to the 5 p.m. halt and at the 6 p.m. reopen, New York time (98.5% of alerts);
- judge results over years (24.9% of three-month stretches lost money).
If every line fits, start with the forward record, every live signal we have sent, and compare it with this page. You can also download all 3,500 backtest trades and check our figures yourself. If any line does not fit, do not subscribe.
How did we measure this?
Data: the 3,500 backtested trades, August 2011 to August 2026, NQ mini 1 to 3 contracts. It reproduces the published headline set: net $1,112,232, 3,500 trades, 45.5% win rate, $51,836 largest dollar drawdown and the 14-trade streak.
Commission of $4.10 per contract round trip is included on every trade; slippage is modelled on market and stop fills, and limit fills carry none. Months and years are calendar periods by exit date; full months exclude the partial August 2011 and August 2026. Weeks run Monday to Friday; a Sunday-evening entry counts toward Monday. Times are New York time.
Drawdown bands come from 10,000 seeded reshuffles of per-trade net P&L, in the record's own dollars; at today's NQ price the same trades would draw down more. Excluded: live fills.
Hypothetical Performance Disclaimer (CFTC Rule 4.41): These results are based on simulated or hypothetical performance results that have certain inherent limitations. Unlike the results shown in an actual performance record, these results do not represent actual trading. Also, because these trades have not actually been executed, these results may have under- or over-compensated for the impact, if any, of certain market factors, such as lack of liquidity. Simulated or hypothetical trading programs in general are also subject to the fact that they are designed with the benefit of hindsight. No representation is being made that any account will or is likely to achieve profits or losses similar to these being shown.
Past performance is not necessarily indicative of future results. Futures trading involves substantial risk of loss and is not suitable for all investors.
See what STS NQ futures signals are and how they reach you and our forward record, every live signal we have sent, dated and public.