Does an NQ strategy only work in a bull market?
Short answer. Not only, but our book does worse when NQ falls. In our hypothetical backtest its average return per trade was positive in 31 of 62 months when NQ fell, against 87 of 119 months when NQ rose. Since June 2021 the gap on that basis is about the same, 15 of 24 against 34 of 39, but close to even in dollars, 18 of 24 against 31 of 39. Inside NQ's large declines the record changed over time. The book lost money in 7 of the first 10, through March 2021, and made money in all 4 since. It finished both NQ down years, 2018 and 2022, positive.
Start with the worst number. The largest drawdown in our hypothetical backtest, $51,836 closed-trade on the 1 to 3 contract book, ran from June 15 to July 20, 2026, while NQ fell 6.0% on our trade prices. $41,110 of it, or 79%, fell in trades entered on or after July 6, 2026, the day our signals went live. Those are backtest fills, not our live fills; our forward record lists every live signal at its actual price.
All dollar figures below are hypothetical backtest results for the five-strategy STS book on NQ mini, sized 1 to 3 contracts by volatility, across 3,500 trades netting $1,112,232 (data as of August 5, 2026). Where NQ's price level would distort a comparison, we use return per trade on notional: a trade's profit divided by the full value of the contracts traded. At an NQ price of 25,000, one mini contract controls $500,000 of index, so 0.1% is 25 points, or $500 per contract.
Did the book do worse in months when NQ fell?
Yes. In our hypothetical backtest the average return per trade was positive in 31 of the 62 months NQ fell (50.0%) and 87 of the 119 months it rose (73.1%). Counted in dollars, the gap is smaller, 37 of 62 against 81 of 119, a gap that could be chance.
Months with at least one trade. Book figures are hypothetical.
| Period | Basis | NQ fell: book positive | NQ rose: book positive |
|---|---|---|---|
| Aug 2011 to May 2021 | Return per trade | 16 of 38 | 53 of 80 |
| Jun 2021 to Aug 2026 | Return per trade | 15 of 24 | 34 of 39 |
| Aug 2011 to May 2021 | Dollars | 19 of 38 | 50 of 80 |
| Jun 2021 to Aug 2026 | Dollars | 18 of 24 | 31 of 39 |
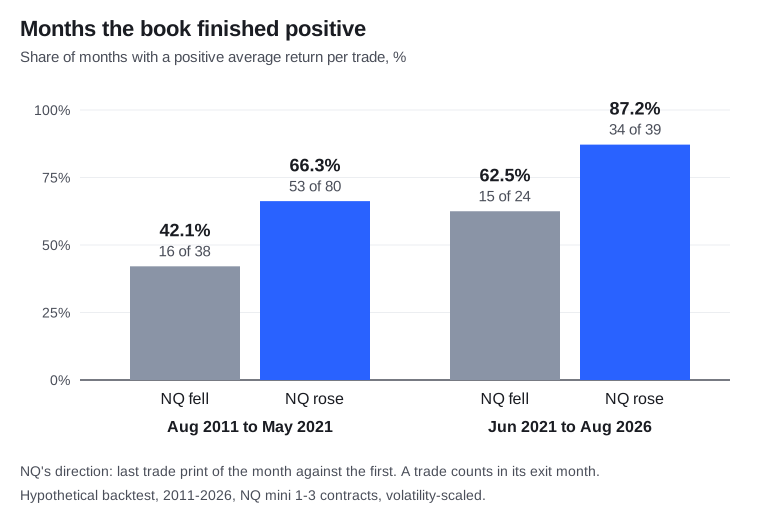
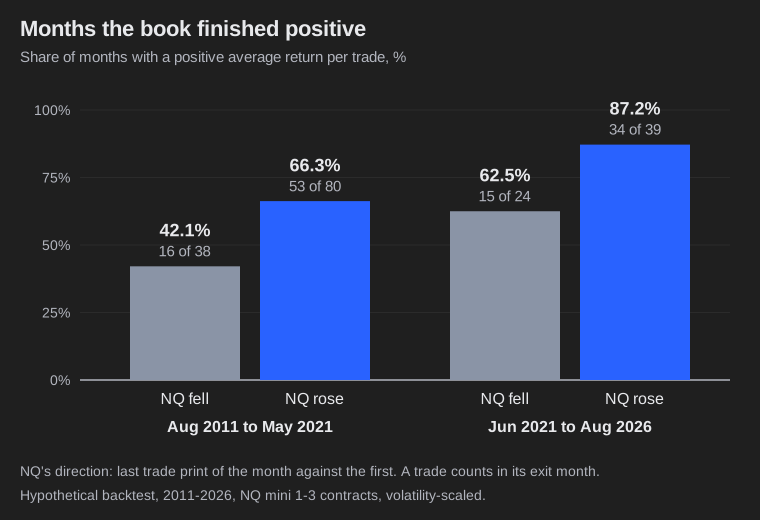
Per trade, the hypothetical book averaged +0.008% on notional in months NQ fell and +0.072% in months it rose.
In dollars the gap closed after mid-2021. On return per trade it did not: the hypothetical book was positive in 62.5% of 24 down months against 87.2% of 39 up months. In dollars it is 75.0% against 79.5%, which is no real difference. Return per trade counts every trade equally, while dollars weight each trade by its contract count, so a month can finish positive on one basis and negative on the other.
It is a long-leaning book. 3,032 of its 3,500 trades are longs, so its good months are mostly NQ's good months.
Did the book lose money in NQ's large declines?
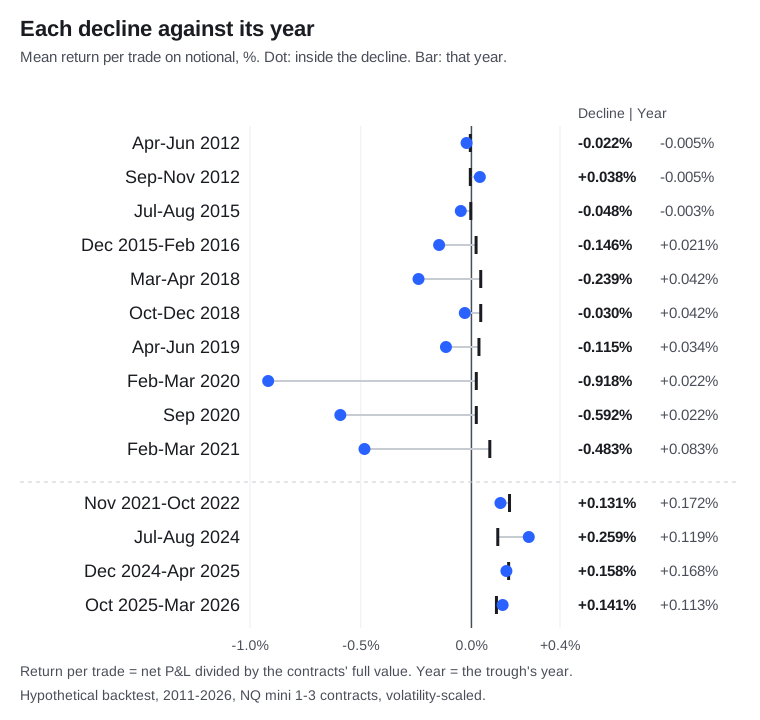
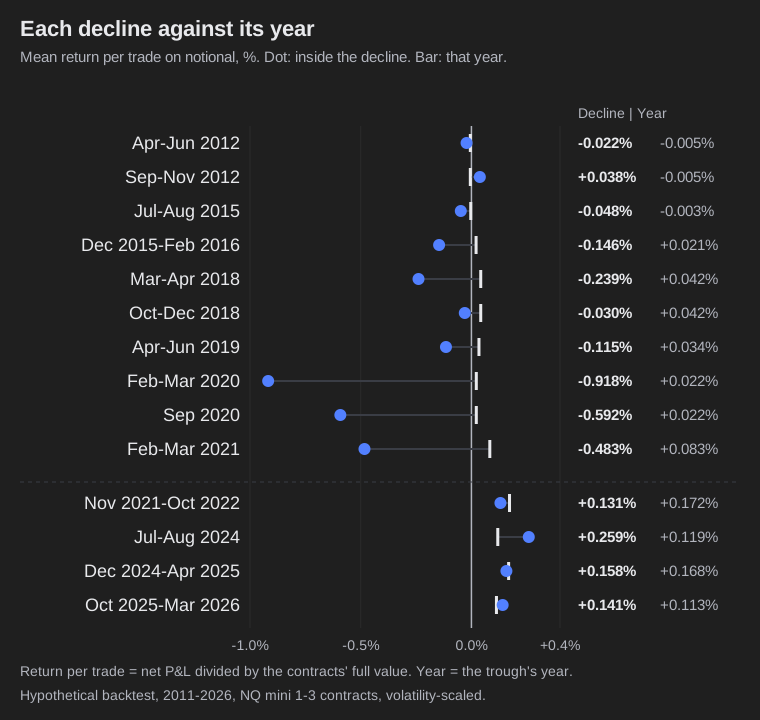
Often through March 2021: in our hypothetical backtest the book lost money in 7 of the first 10 NQ declines of 10% or more from a record high, then made money in all 4 since November 2021. In those 4 it earned about what it earned in the rest of the same years.
Declines of 10% or more from a record high, peak to trough on our own trade prices. Book figures are hypothetical.
| NQ decline | Depth | Book net | Short net |
|---|---|---|---|
| Apr to Jun 2012 | -11.8% | -$375 | +$2,609 |
| Sep to Nov 2012 | -11.6% | +$2,058 | +$2,401 |
| Jul to Aug 2015 | -14.0% | +$1,595 | +$5,733 |
| Dec 2015 to Feb 2016 | -17.5% | -$3,636 | -$178 |
| Mar to Apr 2018 | -11.4% | -$5,554 | -$2,194 |
| Oct to Dec 2018 | -23.1% | +$16,493 | +$36,057 |
| Apr to Jun 2019 | -11.1% | -$10,261 | -$8,808 |
| Feb to Mar 2020 | -28.5% | -$20,004 | -$4,000 |
| Sep 2020 | -13.7% | -$10,027 | $0 |
| Feb to Mar 2021 | -10.3% | -$9,913 | $0 |
| Nov 2021 to Oct 2022 | -36.3% | +$109,685 | +$76,860 |
| Jul to Aug 2024 | -14.5% | +$46,541 | +$45,385 |
| Dec 2024 to Apr 2025 | -22.4% | +$107,248 | +$91,904 |
| Oct 2025 to Mar 2026 | -11.6% | +$114,917 | +$78,139 |
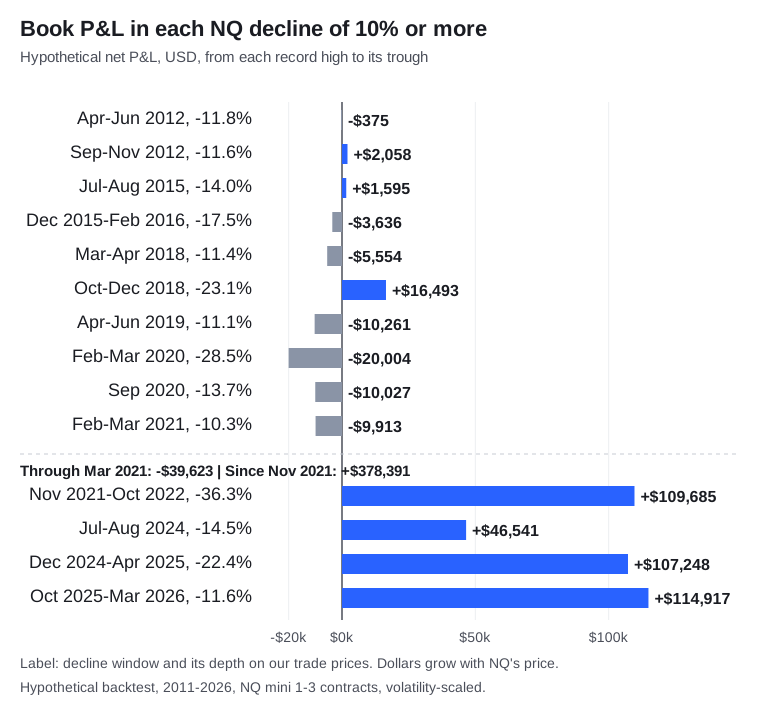
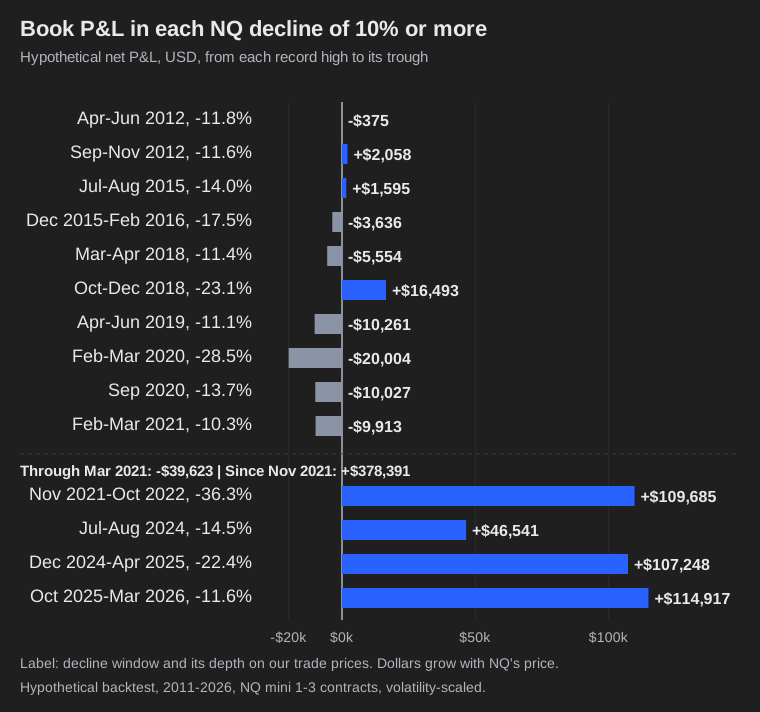
Through March 2021, the fast drops hurt most. The 2020 crash cost a hypothetical $20,004 on 13 trades, 10 of them longs that lost $16,004.
Dollars overstate the recent results, because NQ traded near 2,500 in 2012 and above 20,000 in 2025. Per trade on notional, the hypothetical book's trades inside the 10 declines before mid-2021 averaged -0.133%, against +0.032% for its other trades in those years, a gap that chance does not explain. Since mid-2021, trades in the 4 declines averaged +0.145% against +0.125% for other trades, which is no real difference. All 14 declines are in-sample, and none was traded live. STS signals have been live since July 6, 2026.
How did the book do in the years NQ fell?
It made money in both: NQ fell in 2018 (-1.7%) and 2022 (-32.9%) on our trade-price basis, and the hypothetical book netted +$29,384 and +$95,790.
Calendar years by exit date. Book figures are hypothetical.
| Year | NQ change | Book net |
|---|---|---|
| 2011 (from Aug 11) | +7.0% | -$4,889 |
| 2012 | +14.4% | -$240 |
| 2013 | +32.0% | -$2,899 |
| 2014 | +19.7% | +$9,706 |
| 2015 | +8.3% | +$1,444 |
| 2016 | +8.0% | +$19,746 |
| 2017 | +30.3% | +$19,056 |
| 2018 | -1.7% | +$29,384 |
| 2019 | +39.7% | +$30,315 |
| 2020 | +45.1% | +$51,108 |
| 2021 | +28.6% | +$117,787 |
| 2022 | -32.9% | +$95,790 |
| 2023 | +51.1% | +$96,190 |
| 2024 | +28.1% | +$219,436 |
| 2025 | +20.8% | +$281,973 |
| 2026 (to Aug 5) | +16.2% | +$148,326 |
In 2018 the hypothetical long side lost $3,585 and the short side made $32,969. In 2022 both sides made money, longs +$48,624 on 162 trades and shorts +$47,166 on 28. Two down years is a small sample, which is why the monthly test above carries the main answer.
Which side made the money when NQ fell?
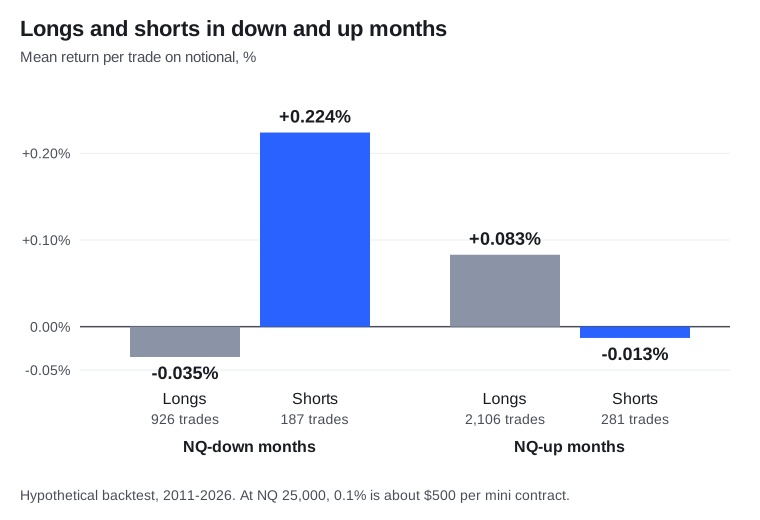
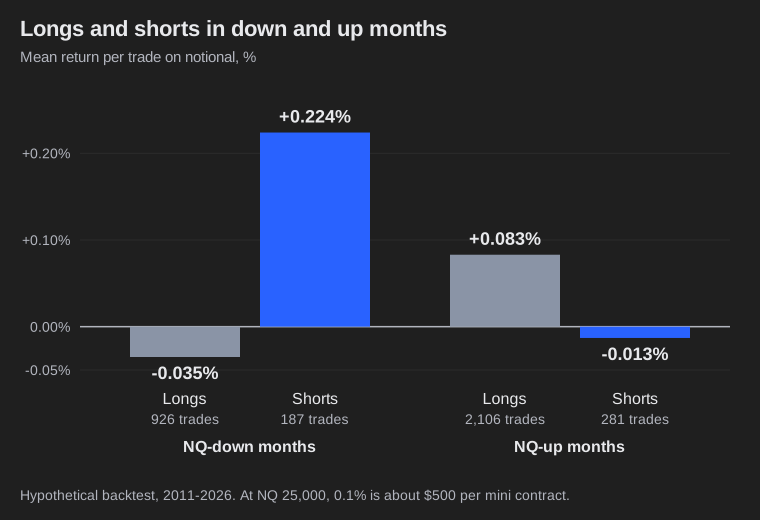
The short side. In NQ-down months, hypothetical shorts averaged +0.224% per trade on notional and longs -0.035%. In NQ-up months it reversed: longs +0.083%, shorts -0.013%.
Hypothetical backtest figures by segment. Win rate is of the trades in that row. Return per trade is net P&L divided by the position's notional value, averaged across trades.
| Segment | Trades | Net | Win rate | Return per trade |
|---|---|---|---|---|
| All longs | 3,032 | $714,213 | 46.2% | +0.047% |
| All shorts | 468 | $398,020 | 40.4% | +0.082% |
| Longs, NQ-down months | 926 | $35,854 | 38.6% | -0.035% |
| Longs, NQ-up months | 2,106 | $678,359 | 49.6% | +0.083% |
| Shorts, NQ-down months | 187 | $318,179 | 48.7% | +0.224% |
| Shorts, NQ-up months | 281 | $79,841 | 34.9% | -0.013% |
| Longs, decline windows | 476 | $14,859 | 37.8% | -0.053% |
| Shorts, decline windows | 104 | $323,908 | 54.8% | +0.403% |
Shorts are 13.4% of trades (468 of 3,500) and 35.8% of hypothetical net profit ($398,020 of $1,112,232).
Shorts did not give the gains back in the rebounds. From each trough to the next record high, hypothetical shorts averaged +0.001% per trade, +$43,403 on 105 trades.
The decline gains are concentrated. Five trades made 40.0% of the shorts' hypothetical $323,908 inside declines, and the largest was a $38,823 VWAP Short trade in December 2024, on an FOMC statement day. Without their 5 best trades, the last 4 declines still netted $248,942.
Hypothetical longs lost $71,243 across the first 10 declines and made $86,102 across the last 4. The $14,859 total nets two opposite results. It is not a break-even.
The short side has a cost in rising years. In 2019, with NQ up 39.7%, hypothetical shorts lost $27,176.
Which strategies carried the book in NQ declines?
VWAP Short, which made $291,890 of the $338,767 the hypothetical book netted across the 14 decline windows (86.2%), while Trend and Opening Range Break together lost $8,556.
Hypothetical net and win rate inside the 14 declines.
| Strategy | Book trades | Net in 14 declines | Win rate in declines |
|---|---|---|---|
| VWAP Short | 409 | +$291,890 | 60.5% (46 of 76) |
| Trend | 945 | -$2,859 | 28.6% (59 of 206) |
| Opening Range Break | 1,282 | -$5,697 | 44.6% (99 of 222) |
| Overnight | 793 | +$23,415 | 45.8% (22 of 48) |
| Intraday Trend | 71 | +$32,019 | 39.3% (11 of 28) |
Trade counts are inside the one-position book and differ from each strategy's standalone count, which covers a different window.
Short entries did not separate the good declines from the bad. Shorts traded in 5 of the 7 declines where the hypothetical book lost money. The two declines with no short trades at all, September 2020 and February 2021, were both losses of about $10,000.
Related: how long STS drawdowns last and is my backtest overfit.
How we measured this
- Data: the full trade list for the current five-strategy book, 3,500 round trips from August 11, 2011 to August 5, 2026, NQ mini, 1 to 3 contracts scaled by volatility, commissions included. Our script reproduces the published net of $1,112,232, the 3,500 trade count and the 45.5% win rate (1,591 of 3,500) exactly. All results are hypothetical.
- NQ direction: the export's own trade prices on the unadjusted continuous front-month contract, roll gaps included. A year's change is the first entry price of the year against the last exit price. A month's direction is its last trade print against its first.
- Months: the 181 calendar months with at least one trade, each trade counted in the month it exited. A month is positive on return per trade if its trades' returns on notional sum above zero, and positive in dollars if its net P&L is above zero. A one-sided Fisher exact test on positive months gives p = 0.0018 on return per trade (0.025 since June 2021) and p = 0.17 in dollars, so the dollar gap alone could be chance.
- Dollars per trade: down and up months both averaged $318. Before mid-2021 down months averaged $18 per trade against $105; since then, $868 against $826. More of the down-month trades fall after mid-2021 (393 of 1,113 trades against 704 of 2,387), when NQ's price and the book's results were both higher.
- Declines: peak to trough on every entry and exit price in order, any drop of 10% or more from a record high. Prices are only sampled when the book traded, so depths are shallower than the index's true decline. January to February 2018 shows -9.4% on this basis and falls under the cut. Declines that start below a prior record are not counted separately: December 2022 (-11.1%, book -$1,766) and July to October 2023 (-10.9%, book +$37,184).
- Hindsight: each decline ends at a trough, and each month has a direction, that is only known afterwards. These describe the record. They are not signals anyone could have acted on.
- Sensitivity: at cuts of 8%, 12%, 15% and 20%, at most half the declines before mid-2021 were positive for the book, and all after, except one at the 8% cut.
- Chance in declines: we slid each set of decline dates across its own period, keeping the window lengths. Before mid-2021, 0 of 2,402 placements produced a result as low as the real one. After mid-2021, 327 of 1,096 produced one as high.
- Sizing: volatility sizing put fewer contracts on in declines, 1.61 per trade on average against 1.85 otherwise, and 1.38 in the 2020 crash. Return on notional is not affected by size.
- Attribution: a trade counts toward a year by its exit date, and toward a decline if it exited after the peak print and on or before the trough. A win is net P&L above zero.
- Excluded: live fills. Trades from July 6 to August 5, 2026 are backtest trades, not live results.
Hypothetical Performance Disclaimer (CFTC Rule 4.41): These results are based on simulated or hypothetical performance results that have certain inherent limitations. Unlike the results shown in an actual performance record, these results do not represent actual trading. Also, because these trades have not actually been executed, these results may have under- or over-compensated for the impact, if any, of certain market factors, such as lack of liquidity. Simulated or hypothetical trading programs in general are also subject to the fact that they are designed with the benefit of hindsight. No representation is being made that any account will or is likely to achieve profits or losses similar to these being shown.
Past performance is not necessarily indicative of future results. Futures trading involves substantial risk of loss and is not suitable for all investors.
See what STS NQ futures signals are and how they reach you and our forward record, every live signal we have sent, dated and public.