How long do trading drawdowns last?
Across 230 drawdowns in our backtested NQ book over 15 years, the median one recovered in 7 days. 54% cleared inside a week, 86% inside a month. So the usual answer to "how long will I be underwater" is: not long.
But the average is not the risk. The single worst stretch held the book underwater for 1,154 straight days, about three years and two months, from August 2011 to October 2014. That long grind is the part that ends accounts, and it was not our deepest dip in dollars. It was a shallower one that just would not clear.
That is the whole finding. Depth gets the attention; duration does the damage. We timed all 230 drawdowns in the book to show you both. Here is the data.
Whose drawdowns are these (read this first)
These numbers are from our own book. Five systematic NQ strategies run as one portfolio that holds a single position at a time. TradingView backtests, July 2011 to July 2026, one to three contracts scaled by volatility, commissions and slippage included, $1,112,232 net over 3,500 trades. The style is momentum and trend continuation, intraday plus one overnight model. Not mean reversion, not scalping.
That matters for what follows. Our exact recovery times are ours. A momentum book claws back in a few big trending moves, not a steady drip. What transfers is the lesson: any track record has a recovery-time distribution with a short middle and a long tail, and the tail is the number that matters. A discretionary trader can run this same walk on their own closed trades.
One definition before the tables. A drawdown here is any dip from a prior equity peak until the book prints a new high. We measure its length in calendar days from peak to new high. We call that being "underwater."
Most drawdowns recover in days, not months
Here is the full recovery-time distribution across the 229 drawdowns that recovered inside our window.
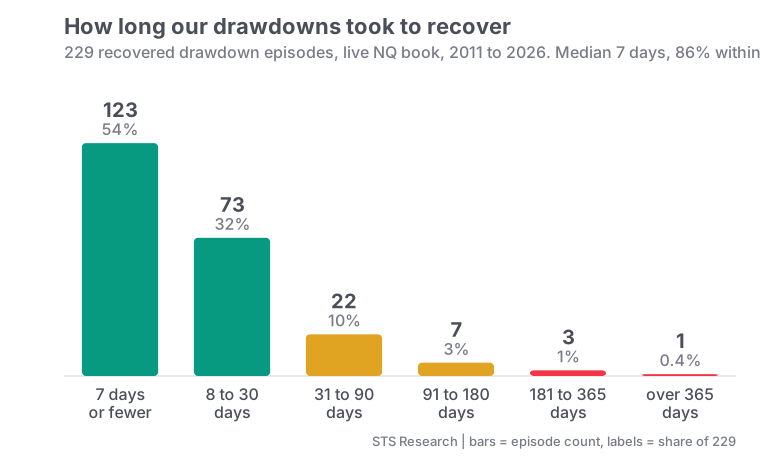
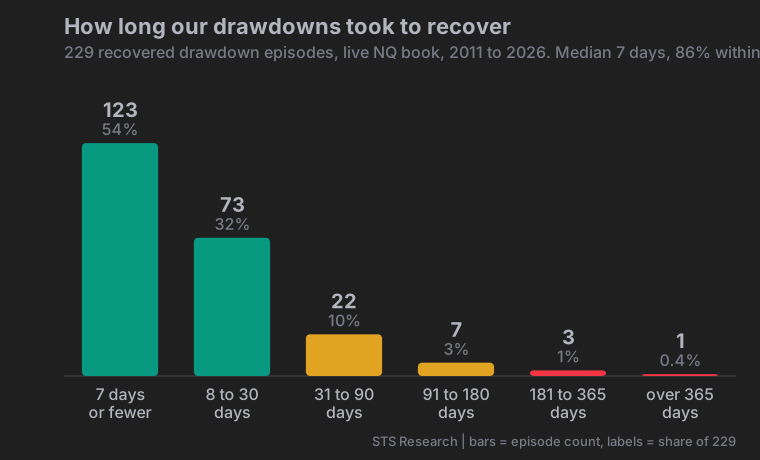
Read it left to right. The two green bars are the comfortable cases, 197 of the 229 episodes, or 86%, that cleared inside a month. The red bars on the right are the tail. Three episodes took more than half a year, and exactly one ran past a full year.
The numbers behind the chart:
| Recovery time (peak to new high) | Episodes | Share |
|---|---|---|
| 7 days or fewer | 123 | 54% |
| 8 to 30 days | 74 | 32% (86% cumulative) |
| 31 to 90 days | 22 | 10% |
| 91 to 180 days | 7 | 3% |
| 181 to 365 days | 2 | 1% |
| Over 365 days | 1 | 0.4% |
The median is 7 days. The mean is 23 days. When the average sits three times above the median, that is the tail talking. A handful of long grinds drag the average up while most episodes finish fast.
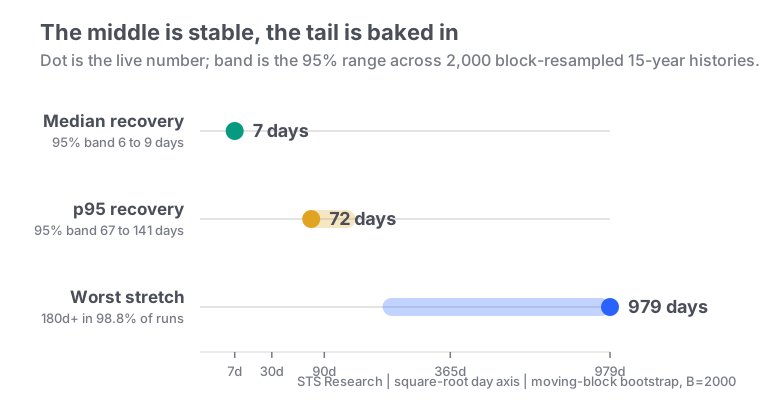
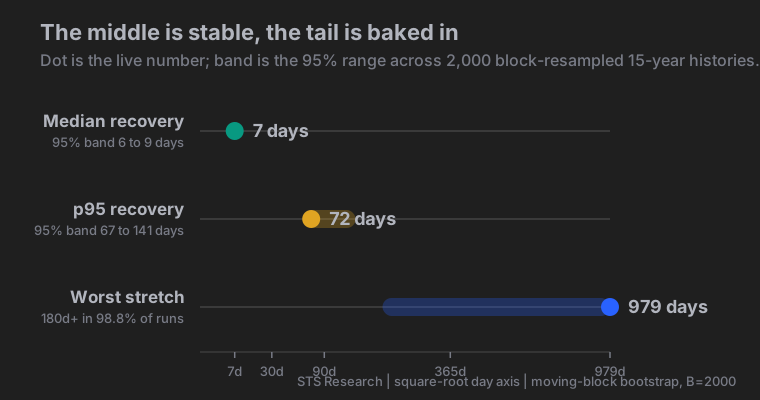
That 7-day median is not a lucky ordering. We block-resampled these trades 2,000 times, keeping runs of 20 consecutive trades intact so a full losing streak survives each shuffle, and our worst losing streak ran 14 trades. Across every resampled 15-year history the median recovery held inside 6 to 9 days. So the comfortable case is stable. It is the tail, not the middle, that moves. If you plan around the median, the tail will surprise you. That is the mistake this article is trying to stop.
The deepest drawdown and the longest are different events
This is the core of it. The dip that costs the most dollars and the dip that keeps you underwater the longest are almost never the same episode.
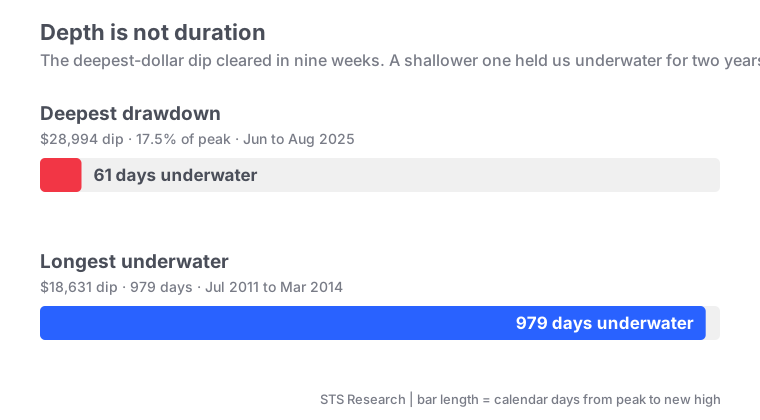
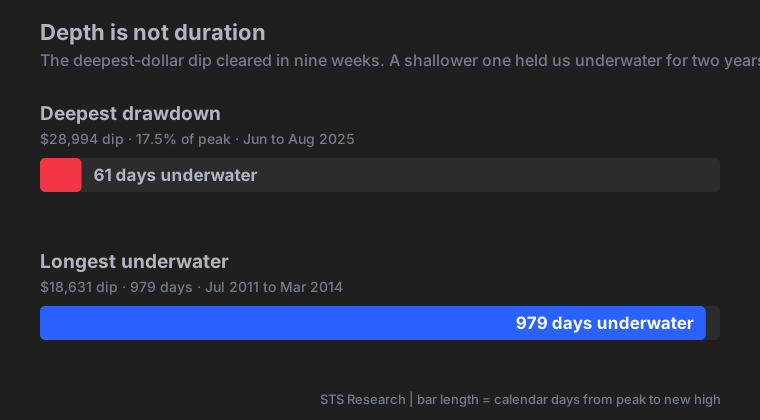
Our deepest dollar drawdown was $51,836, the max dollar drawdown on our tear sheet, which was 4.3% of the peak it fell from (our worst percentage drawdown, 20.4%, is the much older and much longer episode below). It happened recently, peaking June 15 2026, bottoming July 20 2026 and clearing to a new high by August 4 2026. That is 50 days underwater. Our worst dip in dollars, and yet it recovered in seven weeks. Deep, but quick, and easy enough to hold.
Now the other one. Our longest underwater stretch ran 1,154 days, from a peak on August 11 2011 to a new high on October 8 2014. The dip itself was $20,573, far shallower in dollars than the $51,836 max, though it was 20.4% of the small $100,721 account it fell from, which makes it our worst percentage drawdown. Its worst point came 767 days after the peak, and then it took another 387 days just to climb back. A shallower hole in dollars, underwater more than twenty times longer, and far harder to sit through.
That grind had one main author. We tag every trade by which of our five subs fired it, so we can see who bled during the 767-day slide to the bottom. One sub owned most of it: our long-breakout model lost $11,579, about 56% of the whole hole, on a 38% win rate over 186 trades. No single blow-up. A slow, one-sub leak, while the trend models slowly clawed the book back to a new high.
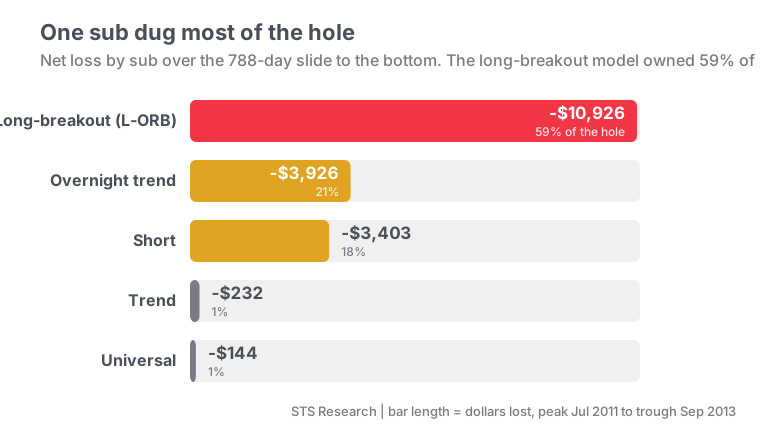
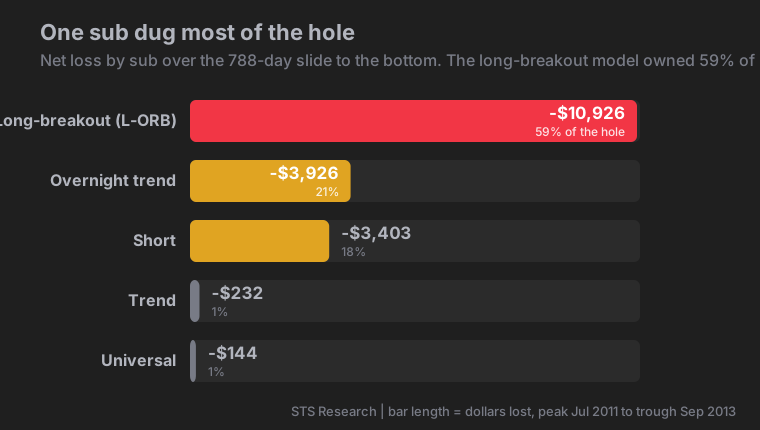
And it was not a crash. The 767-day slide ran across 26 calendar months, 18 of them losing and 8 of them winning, and the worst single month cost $4,336, about a fifth of the hole. The worst single trade in the whole slide lost $1,242. Nothing blew up. The book bled out slowly through calm, choppy, nominally up markets, the exact place a breakout book gets whipsawed. That is why the hole stayed shallow but took more than three years to fill. A crash gives you a deep, fast dip. A long chop gives you a shallow, endless one.
That is the trap in reading a tear sheet. The headline max drawdown is a depth number. It tells you nothing about how long you would have waited to get it back. We wrote a whole companion piece on the depth side of this question, why your live drawdown will probably be deeper than your backtest, where a Monte-Carlo test puts a normal reshuffled low near $45,379 and a one-in-twenty low past $67,838. This article is the other half: not how deep, but how long.
About 86% of the time, the book sat below a prior peak
Here is a number that sounds alarming until you understand it. The book was underwater, meaning below some earlier peak, on about 86% of all calendar days in the window.
That is normal, not a flaw. Any rising equity curve spends most of its life a little below its own high, because a new high is a single instant and the climb to the next one takes time. The honest read is not "the book is usually losing." It is "the book is usually a small fraction below its best mark, on the way to the next one."
So the 86% is not the number to fear. How far below the peak is. Most of those days are fractions of a percent down. The days that test you are the rare ones where you are well underwater and it has already been a year. That is the tail from the distribution above, and it is where the risk lives.
Buy-and-hold QQQ sat underwater 85% of days too
To put the shape in context, we ran the same measurement on buy-and-hold QQQ, the Nasdaq-100 ETF, over the identical 2011 to 2026 window on dividend-adjusted closes.
| Our NQ book | Buy-and-hold QQQ | |
|---|---|---|
| Worst drawdown | $51,836 (4.3% of peak) | -35.1% of value |
| Longest stretch underwater | 1,154 days | 716 days |
| Share of days below a prior peak | ~86% | 84.9% |
Read this as shape, not dollars. The two are different units. Ours is book equity for the one-to-three-contract NQ mini book on a $100k basis; QQQ's is a percent move on a total-return index. You cannot line up $51,836 against -35.1% as the same thing, and we are not.
What does line up is the pattern. Both spent 85% to 86% of days below a prior peak, so "usually underwater by a little" is just what a long-running equity curve looks like. The difference is the worst case. QQQ's worst was a 35.1% hole that took 716 days to clear, from its December 2021 peak to a new high in December 2023. A buy-and-hold Nasdaq investor sat through that. Long underwater stretches are not unique to active trading. They are the cost of being in the market at all.
These day counts are a floor, not a ceiling
Here is the honest limit. We measure recovery on close-of-trade book equity, sampled at trade exits, not on the intraday value of a live account ticking second by second. A real account marks to market on every price move. So a trader watching a live screen will feel underwater on more days, and dip lower inside a day, than this exit-sampled count shows. The direction of the error is known: our day counts are the floor, not the ceiling.
A grind this long is not a fluke of one history either. In the same 2,000 resamples, a stretch of six months or more underwater showed up in 99% of them, and even the mildest 2.5% of resampled histories still had a worst stretch of about 205 days. The backtested 1,154 days is the severe draw in the backtest. The point stands under every reshuffle: a long tail is baked into this book, not an accident of one ordering.
One episode was still open on the export date. The book set its last peak on August 4 2026, and by the August 5 export it sat $5,508 below that mark, about 0.49%. That is not a large open drawdown. It is the book a little off its high on the day we cut the data, which is exactly what you would expect most of the time. We count it as open and honest rather than pretend the record ends on a perfect new high.
Budget for eleven weeks underwater, not one
Budget for a drawdown that lasts about a quarter, not a week.
The median 7-day recovery is the comfortable case, and it is the wrong number to plan around. In our book, 90% of episodes cleared within 46 days and 95% within 79 days. So plan your capital and, just as important, your patience for the p95: roughly eleven weeks underwater, not the 7-day median. The median is the case that feels fine. The p95 is the case that makes people quit a working system one month before it recovers. Sitting a signal out is the milder version of the same instinct, and we priced it in what skipping trades after a loss costs.
One honest caveat on that p95. Unlike the rock-stable 7-day median, the p95 is a tail number resting on a handful of long episodes from one 15-year path. Across the same 2,000 block-resampled histories its 95% band ran from about eleven to twenty-three weeks (75 to 160 days). So treat eleven weeks as a planning floor, not a ceiling: a working system can stay underwater half again as long as the p95 and still be behaving normally.
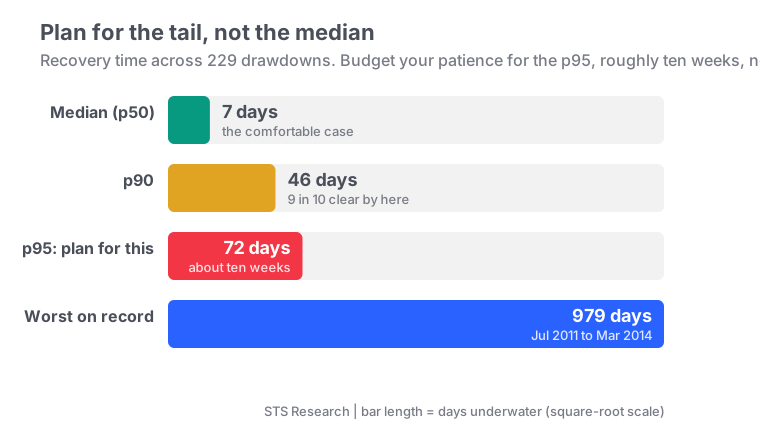
Plan for the tail, not the median. Half of drawdowns recover in a week, but budget for about eleven weeks underwater (our p95 of 79 days), and know that a shallow grind can run far longer than a deep, fast dip. What usually ends accounts is duration, not depth: a shallow grind you cannot sit through, not a fast deep dip.
This is why duration matters most for a funded account. A prop firm's trailing drawdown limit follows your equity by the path, not just the low, so a long shallow grind can breach it even when the dollar dip is small. Size for the path, not the endpoint, which is the arithmetic in what a $25k account can actually hold and, in one line, in the prop-firm trailing drawdown calculator. And if your first question is whether the edge that recovers these drawdowns is even real rather than curve-fit, that is how to tell if a backtest is overfit.
We publish the ugly stretches the same way we publish the profit. The full 15-year record, drawdowns and all, is on our strategies page and the tear sheet. Our subscribers trade the signals from the same five systems measured here; plans are on the pricing page.
How we measured this
Instrument: CME Nasdaq-100 E-mini (NQ), $100,000 starting capital, no compounding, one to three contracts scaled by volatility, the same sizing the live signals deliver. Data: the TradingView list-of-trades export from our five-strategy book, covering 2011-08-11 through 2026-08-05, 3,500 trades, commissions and slippage already inside the net P&L. The book totals reconcile to our published canonical stats.
Method: we rebuilt close-of-trade equity from the export, then walked it peak to peak. Each time equity fell below a prior high and later printed a new high, we logged one drawdown episode with its depth in dollars, its depth as a percent of the peak it fell from, and its length in calendar days from peak to new high. We ran that walk two independent ways: one script re-summing equity from the per-trade P&L column, a second reading the export's own cumulative-P&L column with a different parser and day loop. Both returned the same 230 episodes, the same 7-day median, and the same 1,154-day longest and 50-day deepest anchor episodes. The QQQ contrast is a separate recompute on Yahoo Finance dividend-adjusted daily closes over the same window, run by both scripts.
Three further checks back the tail claims. The 6-to-9-day median band and the "long tail in 99% of histories" come from a moving-block bootstrap, 2,000 resamples of 20-trade blocks, re-run under a second random seed with the same result. The per-sub split of the 1,154-day drawdown tags each trade by the sub that entered it over the 767-day slide to the bottom, and was recomputed a second independent way and matched to the cent.
The limits, plainly. Recovery days are exit-sampled, not intraday, so they understate how underwater a live account feels day to day, as noted above. The two day-loops bracket the time-underwater figure between 85.8% and 86.2%, so we report it only as "about 86%" and not a sharper number. These are hypothetical backtest results, not live fills. What would falsify the "short median, long tail" claim: a live record whose recovery times clustered tight with no long grinds. Fifteen years of our data show the opposite.
Disclosure. We trade this book live and sell access to the signals, so judge the data accordingly. This article is educational and is not investment advice, a recommendation, or an offer to buy or sell any security or futures contract.
Hypothetical performance disclaimer (CFTC Rule 4.41). The results described here are based on backtested and hypothetical performance. Hypothetical performance results have many inherent limitations, some of which are described below. No representation is being made that any account will or is likely to achieve profits or losses similar to those shown. In fact, there are frequently sharp differences between hypothetical performance results and the actual results subsequently achieved by any particular trading program. One of the limitations of hypothetical performance results is that they are generally prepared with the benefit of hindsight. In addition, hypothetical trading does not involve financial risk, and no hypothetical trading record can completely account for the impact of financial risk in actual trading. For example, the ability to withstand losses or to adhere to a particular trading program in spite of trading losses are material points which can also adversely affect actual trading results. There are numerous other factors related to the markets in general or to the implementation of any specific trading program which cannot be fully accounted for in the preparation of hypothetical performance results and all of which can adversely affect actual trading results.
Past performance does not indicate future results.