Your Backtest Drawdown Is One Draw, Not a Floor
The worst drawdown in our NQ backtest was $51,836 on the NQ mini book, which is 4.3% of the peak it fell from. Our worst drawdown in percentage terms is a separate, earlier episode, 20.4%. That is the number on our tear sheet, and on its own it tells you almost nothing. When we reshuffled the same 3,500 trades 10,000 times, the typical worst drawdown came out around $45,379, and one ordering in twenty ran past $67,838. Our realised figure landed at the 72nd percentile of those paths: about seven in ten alternate orderings of our own trades came out better than the one history dealt us. So the backtest number is not a floor and it is not a ceiling. It is one sample from a distribution whose tail is deeper than anything in the backtest.
This is the honest answer to a fair question a buyer asks us: will that 20.4% hold up live? It is not the number to lean on. We work in dollars from here on, all for the book as it actually traded, the NQ mini sized one to three contracts by volatility. A reshuffled drawdown can hit at any point on the equity curve, so it does not map to one clean percent. Here is the data, and here is what to do about it.
Whose trades are these (read this first)
These numbers are from our own book: five systematic NQ strategies run as one book that holds a single position at a time. TradingView backtests, 2011 to 2026, one to three contracts scaled by volatility, commissions and slippage included, $1,112,232 net. The style is momentum and trend continuation, intraday plus one overnight model. Not mean reversion, not scalping.
That matters here in one specific way. The drawdown math below is about the order trades happen in, and that is not unique to our system. Any track record, yours included, is one ordering of history. So the method transfers cleanly even though our exact dollar figures do not. A discretionary trader can run this same test on their own closed trades and learn the same lesson. The $45,379 is ours. The idea that a track record's worst drawdown is one draw out of billions is everyone's.
The backtest drawdown is one roll of the dice
A max drawdown is the worst peak-to-trough dip your equity took. Most people read it as a hard floor: "the worst this can do is 20.4%." That is the mistake.
Your drawdown does not depend only on which trades you took. It depends heavily on the order they arrived in. Cluster your losers together and you get a deep drawdown. Spread them out and you barely notice them. The backtest shows you exactly one order: the one history happened to deal. Billions of other orders would have produced the same final profit with a very different worst dip.
So we tested the other orders.
We took the 3,500 backtested trades, kept every win and loss exactly as it was, and shuffled the sequence at random 10,000 times. Each shuffle is a full alternate history with the same edge and the same trades, just dealt in a different order. For each one we measured the worst drawdown. That gives a distribution: not one drawdown number, but the full range of drawdowns this strategy can produce.
The one you have seen is one point in a wide distribution
Here is that distribution.
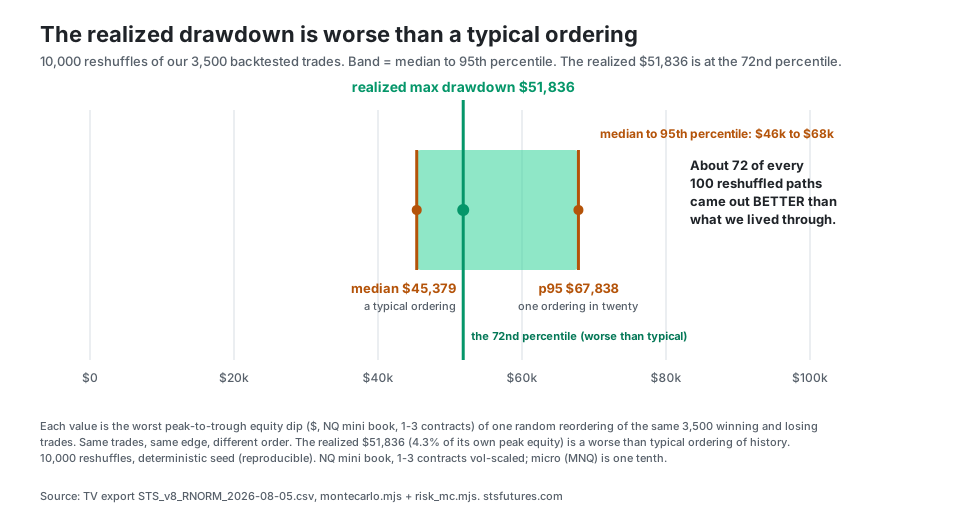
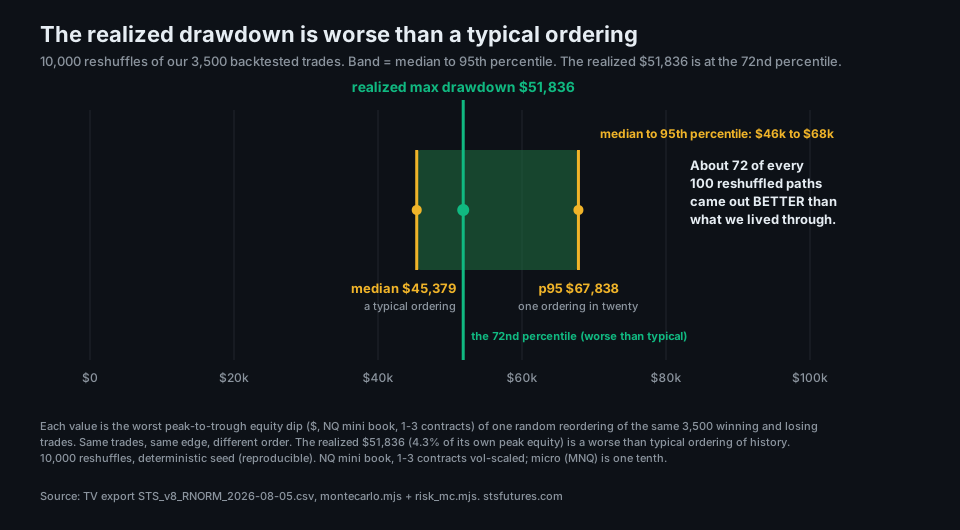
Read it left to right. The green line is our actual backtested drawdown, $51,836. The amber band is the middle 90% of what the strategy can do. The median, the most ordinary outcome, is $45,379. The p95, the level only 1 in 20 shuffles got worse than, is $67,838.
The backtested drawdown landed at the 72nd percentile of all those paths. Said another way: about 72 of every 100 reshuffled histories drew down less than the backtest did. We did not get a smooth run. We got a rougher-than-average one, and it still sits well inside the distribution rather than at its edge.
The three numbers side by side make the point harder to ignore.
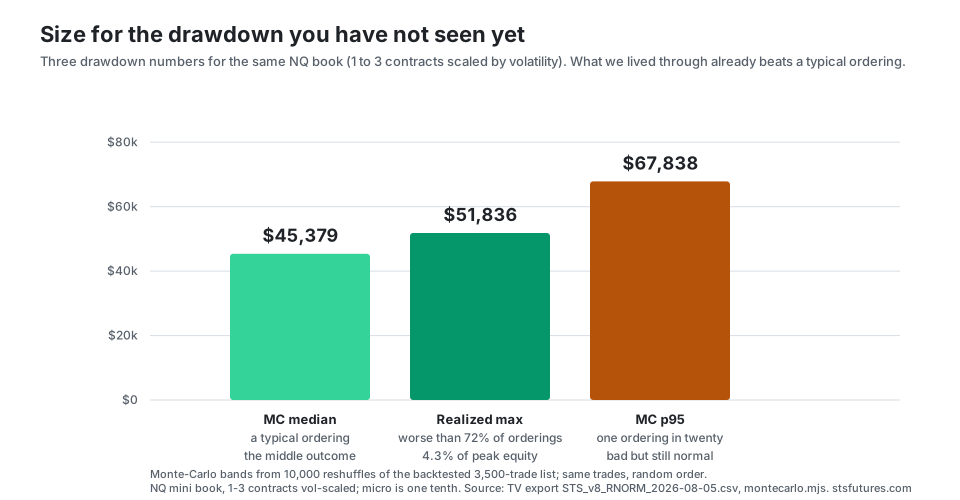
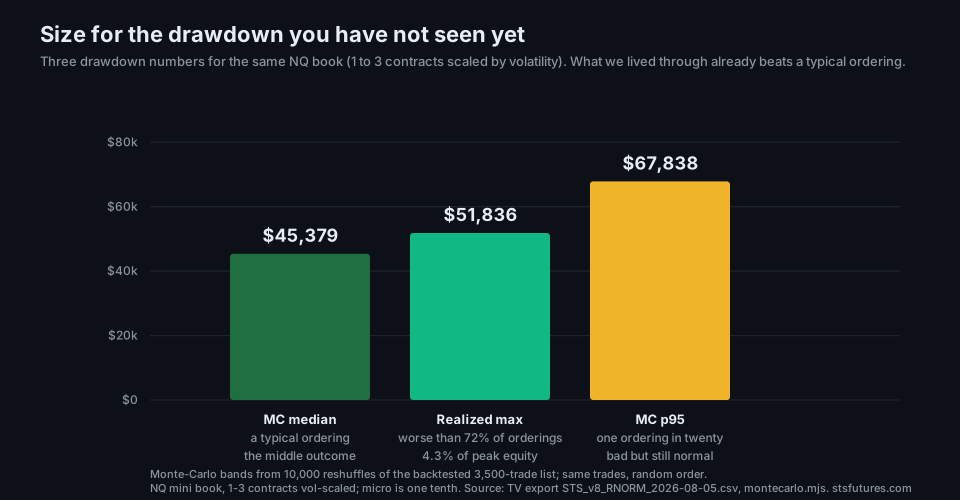
The backtest is about 14% deeper than the median ordering. The p95 is another 31% deeper than the backtest. Nothing changed about the strategy. We just stopped pretending the one history we saw was the only one possible, or the worst one possible.
A backtest max drawdown is one draw dressed up as a limit. Size your account so that the drawdown you have NOT seen yet, roughly the Monte-Carlo p95, is survivable. For our book that is $67,838 on the NQ mini book, not the $51,836 the backtest produced.
Why this happens, and why the edge is still real
Two questions usually come up here, so let us answer both straight.
First: does a worse-than-backtest drawdown mean the edge is broken? No. We ran a second test on the same trades, a bootstrap. Instead of just reshuffling the trades, it draws them at random with repeats allowed. The total profit stayed strongly positive in every one of those runs. The 5th-percentile result was still about $839,000. So the edge holds up. What is fragile is the smoothness of any single path, not the profit itself. A real edge and a deep drawdown live together comfortably.
Second: which number do I trust, $46k or $68k? Use both, for different jobs. The median ($46k) is what to expect over a long enough live run. A drawdown that size is the strategy working as designed, not a reason to quit. How long you would sit in one is a separate question, answered in how long our drawdowns last. The p95 ($68k) is what your account has to survive. If a p95 drawdown would bust you or trip a hard account limit, you are trading too big, full stop. Our own risk rules work the same way. A new all-time drawdown still inside the shuffle's range counts as the edge working. We cut size as a drawdown gets close to the p95, and halt new entries if it blows past it.
One honest caveat. The reshuffle assumes the order of trades carries no information, that any trade was equally likely to come at any time. Real markets do not work that way. They have streaks, and losers can pile up together in one bad stretch of market. There is a second problem specific to a 15-year record on an index that went from about 2,100 to about 30,000: an average trade in the last third of the book is several times the size of one in the first third, so a global shuffle drops late-era trades into an early-era equity curve. We checked with reshuffles that keep trades in short actual-order chunks, and with one stratified inside each calendar year. Both come out gentler than the global shuffle. We are not publishing their exact figures, because they do not hold steady enough to call reproducible to our standard. The direction is what we rely on: the fully-reshuffled $67,838 is the most conservative of the methods we tried, and it is the number we build the account to survive.
How we measured this
Instrument: CME Nasdaq-100 E-mini (NQ), $100,000 starting capital, no compounding, the NQ mini sized one to three contracts by volatility, the same sizing the live signals deliver (a micro MNQ account trades the identical book at one tenth the dollar size, so every figure here is ten times a micro account). Data: our live five-strategy intraday book, backtested on TradingView, 2011-08-11 through 2026-08-05, 3,500 trades, commissions and slippage already inside the net P&L.
Method: this is a Monte-Carlo on the backtested trades, not a new backtest. We keep the exact set of 3,500 wins and losses, shuffle their order at random 10,000 times, and record the worst peak-to-trough equity dip of each ordering. The median and the 95th percentile of those 10,000 drawdowns are the headline numbers, and the iteration count is part of the result: a different number of shuffles is a different number.
The limits, plainly. A reshuffle inherits TradingView's fills because it uses TV's backtested trades, but it is still an approximation of the future, not a backtest of a strategy change. It holds the book's own volatility-based one-to-three contract sizing rule fixed, with no equity-based scaling and no compounding, and it treats trades as independent of each other. It cannot model a brand-new market regime that produces losses bigger than any in the 15-year sample. What would falsify the "size for the tail" claim: live drawdowns that consistently came in below the reshuffle median over many years. We are not counting on it, and neither should you.
What to do with this
Run the shuffle on your own trades. If you have a backtest or a live record with at least a few hundred closed trades, reshuffle the order a few thousand times and look at the spread of drawdowns. The single max-drawdown number on your report is one draw from that spread. It can land anywhere in it, and selection makes the low side more likely than the high side, because a clean run is what makes a backtest look good enough to trade in the first place.
Then size off the drawdown you have not seen. Take your strategy's Monte-Carlo p95 drawdown, not its backtested max, and make sure your account survives it with room to spare. Scale it to your own size: our $68k p95 is for the NQ mini book exactly as it traded, one to three contracts scaled by volatility, so a micro (MNQ) account running that same book is a tenth of that. If you take the signals at a larger multiple than we do, scale the dollar figure by that multiple. For a prop account with a hard trailing limit, the loss line that follows your equity up, this is the difference between passing and blowing up. We worked the funded-account version of that arithmetic in combine reset math, where the same reshuffle decides the bill instead of the position size. If you also want to know whether the edge behind the drawdown is real or curve-fit, that is is my backtest overfit.
We publish our drawdowns the same way we publish our profit, including the parts that flatter us less. The full set of live numbers is on the strategy page and the tear sheet, and our subscribers get the signals from the same five systems measured here; plans are on the pricing page.
We trade this book live and sell access to the signals, so judge the data accordingly. This article is educational and is not investment advice. Futures trading involves substantial risk of loss and is not suitable for every investor.
Hypothetical performance disclaimer (CFTC Rule 4.41): hypothetical or simulated performance results have certain limitations. Unlike an actual performance record, simulated results do not represent actual trading. Also, since the trades have not been executed, the results may have under- or over-compensated for the impact, if any, of certain market factors, such as lack of liquidity. Simulated trading programs in general are also subject to the fact that they are designed with the benefit of hindsight. No representation is being made that any account will or is likely to achieve profit or losses similar to those shown. Past performance does not indicate future results.