TopStep vs Apex vs MFFU: we tested the 50k rules on our 15-year backtested NQ book
On the correct, current $2,000 50k drawdown rules, TopStep, Apex (end-of-day) and MyFundedFutures are byte-for-byte identical on our book: replay our backtested 3,500-trade NQ sequence through all three and they bust at the same trade, on the same day, at the same floor. The old comparison-blog line that "Apex is most forgiving" was true only under Apex's legacy $2,500 floor, which is a separate product line Apex still sells alongside the current one rather than a retired rule (verified on Apex's own pages, 2026-08-03); on the current $2,000 floor that claim is false. What actually decides whether a backtested 15-year book survives is not the brand, it is the drawdown lock point and the trading platform: one micro contract on any lock-at-breakeven product survives about 91% of possible start dates, while Apex's still-trailing evaluation floor on Tradovate, which never locks, busts the same book about 99.6% of the time. At two or more micros, every current product busts.
Whose trades are these
One systematic NQ book, six strategies (five active, one retired) sharing a single position at a time. Window: August 11, 2011 to August 5, 2026. From a TradingView List-of-Trades export dated August 5, 2026: 3,500 closed trades, net $1,112,232.40 on a $100,000 nominal basis, across 2,540 distinct exit days. We did not model a generic ruleset an affiliate blog could publish. We replayed our own backtested trade sequence in its actual historical order, with each trade's maximum favorable and adverse excursion, against each firm's trailing-drawdown floor as a state machine, and recorded which firm and size the book survives. That replay is the one comparison only we can run.
Scale matters before anything else. The mini (NQ, $20 per point) is an instant kill on any $2,000 floor: the mini book's worst intrabar drawdown is $55,050, about 28 times the floor. The only viable unit is the MNQ micro ($2 per point), and even there the book's worst intrabar drawdown is about $5,505, one tenth of the mini and nearly three times a $2,000 floor, which is exactly why a $2,000 floor is tight on this mature book. "One micro" below means the book's own 1-to-3 volatility sizing expressed in micros: 1 to 3 MNQ, the smallest tradeable size. If a product busts at one micro, it cannot be run at all.
At one micro, the lock point decides everything
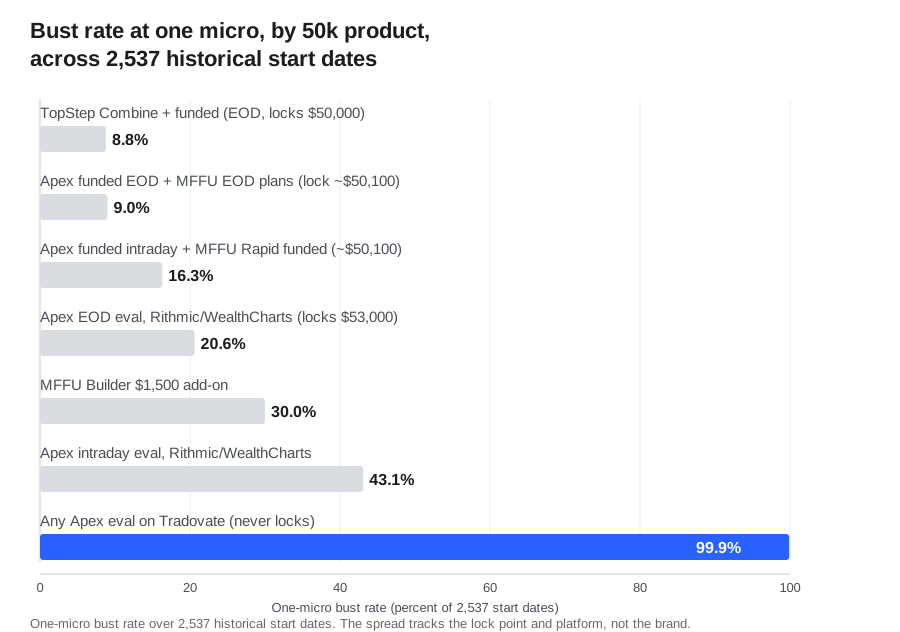
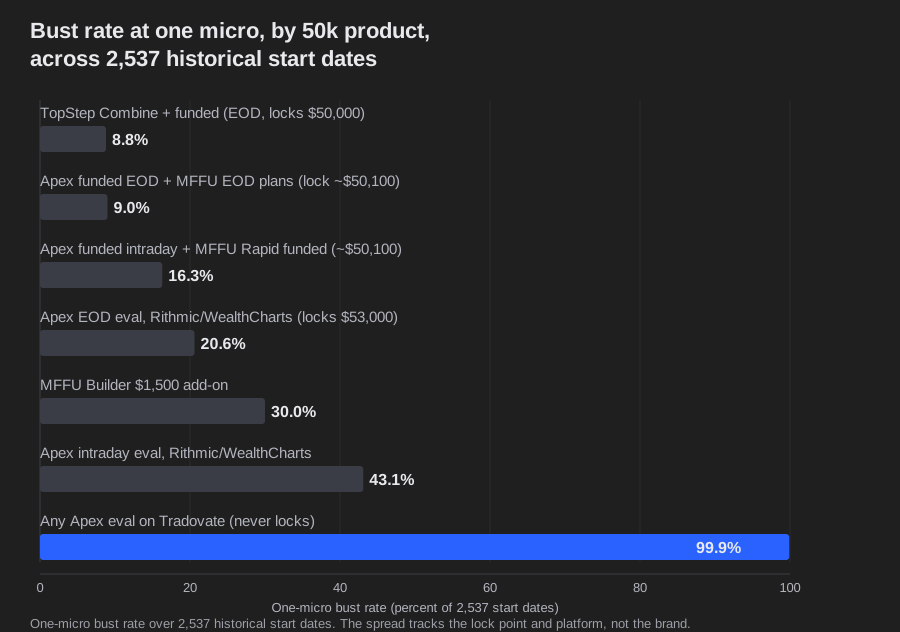
Run every current 50k product over all 2,540 historical fund dates at one micro, and the bust rate ranges from 9.0% to 99.6%. That spread is almost entirely explained by two things: where the drawdown floor stops trailing (locks), and which platform trails it.
| Product, 50k | Ratchet basis | Where the floor locks | Bust rate at 1 micro (2,540 starts) |
|---|---|---|---|
| TopStep Combine and funded | end-of-day | $50,000 (breakeven) | 9.0% |
| Apex funded (PA), EOD; MFFU EOD plans | end-of-day | ~$50,100 (start + $100) | 9.3% |
| Apex funded (PA), intraday; MFFU Rapid once funded | intraday | ~$50,100 (start + $100) | 16.4% |
| Apex EOD evaluation (Rithmic/WealthCharts) | end-of-day | $53,000 (profit target) | 20.6% |
| MFFU Builder $1,500 add-on | end-of-day | ~$50,100 (start + $100) | 30.1% |
| Apex intraday evaluation (Rithmic/WealthCharts) | intraday | $53,000 (profit target) | 43.0% |
| Any Apex evaluation on Tradovate | either | never locks (trails forever) | 99.6% |
Step up in size and there is no reprieve. At two micros every product's bust rate jumps to between 55% and 100%; at three micros, 67% to 100%. There is no current 50k product on which this book reliably survives at two or more micros, and none survives on Tradovate at any size.
On the current rules, three brands are one machine
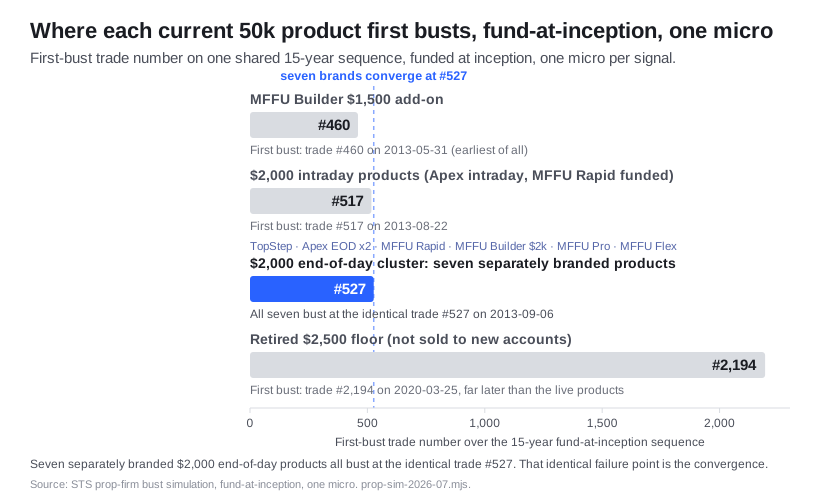
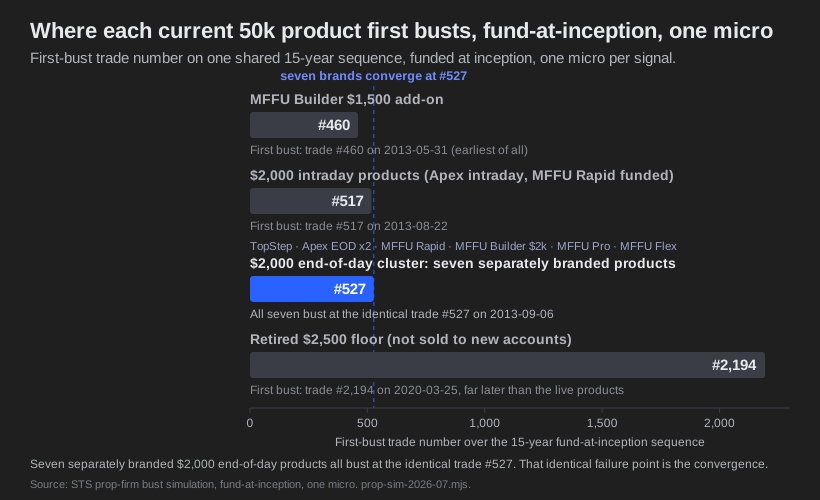
Fund at inception in 2011 and trade the whole book at one micro, and every current 50k product busts. The entire $2,000 end-of-day cluster (TopStep Combine, Apex EOD evaluation, Apex EOD funded, MFFU Rapid evaluation, MFFU Builder $2,000, MFFU Pro, MFFU Flex) busts at the identical point: trade #513, September 9, 2013, floor at $48,072, balance $48,079. The $2,000 intraday products bust six trades earlier, at #507, August 29, 2013. Seven separately branded products failing at the same trade, on the same day, is the proof that on our book they are not different machines.
The $500 the old article rode on
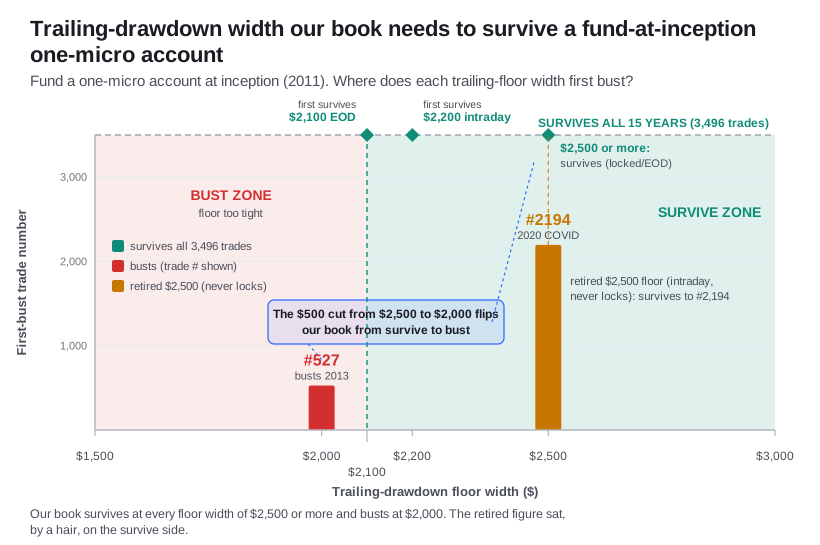
A floor-width sweep shows our book needs $2,100 (end-of-day) or $2,200 (intraday) to clear the 2013 stretch that kills a fund-at-inception one-micro account on the current rules. So the legacy Apex $2,500 floor was, by a hair, enough to get past it: it carries from inception all the way to trade #2179 (March 25, 2020, the COVID crash). The current $2,000 floor fails at trade #513 in 2013, by under $100 of margin. The $500 cut from $2,500 to $2,000 is precisely what flips our book from survive to bust. That is why a comparison citing the $2,500 number made Apex look "most forgiving," and why publishing that retired figure as current was both wrong and load-bearing. We use the legacy width only as a contrast; we do not model or recommend the retired plan.
Platform beats brand
Within Apex alone, the platform choice swings the outcome more than any difference between the three firms. On Rithmic or WealthCharts the evaluation floor stops trailing once it reaches the $53,000 mark; on Tradovate it trails $2,000 behind the peak forever and never locks. That single choice moves the one-micro bust rate from 43.0% to about 99.6%, a larger effect than any gap between the three brands. The lock point, not the logo, is the variable that matters. A related but smaller effect: intraday-ratchet products bust earlier than their end-of-day twins (trade #507 versus #513 at one micro, #82 versus #116 at three micros), because the floor ratchets up on the position's unrealized high.
One micro, on a floor that locks at breakeven, or nothing
At one micro on a lock-at-breakeven product, the book is genuinely survivable: about 91% of historical start dates survive. Everything above two micros, and everything on Tradovate, is not. The answer to "how many contracts" is one, and only on a floor that locks at breakeven.
The consistency cap, the other rule traders worry about, never touches this book. Firms typically cap the share of profit that can come from a single day at 50%. On our record the best single day is only 1.5% to 2.0% of positive-day profit over the run to a $3,000 target, because our profit is spread across hundreds of days, not one windfall. The honest caveat: at one micro the account busts on the drawdown floor at trade #513 in 2013, long before it banks $3,000 net alive (that crossing does not happen until trade #1446 in 2017), so on the drawdown-limited path the consistency rule is moot anyway. We work the general case, where a fat-tailed book and a short cap collide, in why a fat-tailed book and a short consistency cap are structurally opposed.
Methodology
Instrument: MNQ micro. The mini NQ is an instant kill (its worst intrabar drawdown of $55,050 is about 28 times a $2,000 floor). Source: our TradingView List-of-Trades export dated August 5, 2026, 3,500 trades, net $1,112,232.40, August 11, 2011 to August 5, 2026, 2,540 distinct exit days; book figures reconcile two independent ways against canonicalStats.ts, and costs of about $4.10 per contract round-trip are already netted in the export. Engine: each trade is replayed in exit-time order against each firm's trailing floor as a state machine. Worst intrabar equity (balance plus the open trade's adverse excursion) is checked before every trade for every firm, because all three enforce the floor in real time on unrealized loss even where the ratchet updates end-of-day. Sizing is s = M/10, the book's own 1-to-3 volatility sizing in micros times M, with tables at M of 1, 2 and 3; M=1 is 1 to 3 MNQ, the smallest tradeable size. Rolling-start results run over all 2,540 historical fund dates; medians are taken over busted starts only.
The rules, with primary sources and retrieval dates:
- TopStep 50k: max loss limit $2,000, end-of-day ratchet, breaches intraday on unrealized loss, floor locks permanently at $50,000. Source: help.topstep.com articles 8284204 and 8284197, retrieved July 20 and July 18, 2026.
- Apex 50k, current: drawdown $2,000 (not the legacy $2,500), profit target $3,000; the evaluation floor locks at $53,000 on Rithmic and WealthCharts and never on Tradovate; the funded (PA) floor locks at $50,100. Source: apextraderfunding.com help center intraday and end-of-day evaluation pages, read in-browser July 18, 2026 and re-confirmed July 20, 2026 (Apex blocks automated fetches, so this was verified by hand in the browser).
- MyFundedFutures 50k: max loss $2,000, target $3,000; the Rapid plan trails end-of-day during evaluation and flips to intraday once funded; all MFFU plans lock at start plus $100 ($50,100); the Builder $1,500 add-on carries a $1,500 end-of-day floor throughout. Source: myfundedfutures.com/plans/rapid and help.myfundedfutures.com, retrieved July 20 and July 18, 2026.
What would falsify this: if any firm's current 50k drawdown is not $2,000, or its lock point differs from what we modeled, the convergence result breaks. These third-party rules carry an expiry and are re-verified quarterly; last checked July 2026.
The limits we will state plainly
The intraday-floor reconstruction assumes an instant ratchet and does not let a trade's own favorable excursion pre-lift its floor before that same trade's adverse excursion is checked, so our intraday bust counts are a lower bound: intraday harshness is understated here, never overstated. The legacy Apex $2,500 plan is modeled with an infinite lock because we did not re-model its legacy lock rules, so its 99.6% rolling-start bust rate is dominated by that assumption and is not comparable to the current lock-bounded products; use its single inception result for the $2,500-width contrast only. And a state machine over a fixed 15-year sequence measures how this exact book met these exact rules. It is not a forecast of a different book, a different size path, or a different market. One more limit matters more than the rest, and it cuts against us. Every survival rate here comes from the order history actually dealt, varied only by start date. When we reshuffle the same 3,500 trades 10,000 times, the backtest ordering lands at the 72nd percentile of drawdowns: about 28 of every 100 orderings drew down more than we did, and roughly one in twenty ran past $67,838 on the mini book. A deeper drawdown against a fixed floor busts sooner, so a meaningful minority of orderings would produce worse survival numbers than the ones on this page. We have not re-run the floor state machine across all 10,000 orderings, so we are not going to quote you an adjusted bust rate we did not compute. The direction of that tail is not in doubt. The method behind the reshuffle is in expect a worse drawdown than your backtest.
What to do differently tomorrow
Stop comparing prop-firm brands. Compare two things: where the drawdown floor locks, and which platform trails it. For a real momentum book like ours, run exactly one micro, only on a product whose floor locks at breakeven, and never on a platform whose floor never locks. Then open the firm's own current 50k rule page and confirm with your own eyes that the drawdown reads $2,000, not a grandfathered $2,500, and run that floor and your own lock point through the prop-firm trailing drawdown calculator. For the drawdown math behind sizing this small, see why you should expect a worse drawdown than your backtest and why we trade MNQ micros instead of NQ minis. The full book, with its losing years and its stated limits, is on our tear sheet; if you would rather run the finished signals than build and babysit the machine, that is what we sell on our pricing page.
Conflict disclosure: we trade this book live and we sell access to the signals. Judge the data accordingly.
CFTC Rule 4.41: Hypothetical or simulated performance results have certain limitations. Unlike an actual performance record, simulated results do not represent actual trading. Also, since the trades have not actually been executed, the results may have under- or over-compensated for the impact, if any, of certain market factors, such as lack of liquidity. Simulated trading programs in general are also subject to the fact that they are designed with the benefit of hindsight. No representation is being made that any account will or is likely to achieve profit or losses similar to those shown.
Past performance is not indicative of future results.