The prop consistency rule vs fat-tailed systems: a 30% cap blocks 2 of 3 windows
On the STS NQ book, our backtested 15-year record, the single best day is just 4.0% of all profit. Over the full record it never trips a 30%, 40%, or 50% consistency cap. But a prop firm does not measure you over 15 years. It measures you over a payout cycle, about a month. Inside a rolling 30-day window the best day is a median 35.7% of that window's profit, and a 30% consistency cap binds in 67.4% of those windows.
So the answer to the title is yes, but with a catch. A consistency rule can punish a big-day system, but only inside the short payout cycle, never over the long run. The two numbers above are the same book through two lenses, and the gap between them is the whole story: a consistency rule caps how much of your profit one day is allowed to make, and a momentum system makes most of its money on a few days. They are opposed on short horizons and reconcile only when the window is long enough to average the big days out.
Whose trades are these (read this first)
These numbers come from the STS NQ book: five systematic NQ strategies run as one single-position portfolio. TradingView backtests, August 2011 to August 2026, one to three contracts scaled by volatility, commissions and slippage included, $1,112,232 net across 3,500 trades. The style is momentum and trend continuation, intraday plus one overnight model. Not mean reversion, not scalping.
That matters here more than usual. A momentum book is fat-tailed on purpose: it takes many small losses and a few large wins. The share numbers below are a property of that shape. A different style, one that grinds out many small even wins, would show a flatter profile and trip a consistency cap far less. So take the shape and the method, not our exact percentages. A trader copying our signals would trade different size, costs, and days, so their own per-day distribution is theirs to measure. We publish how concentrated our book is, never a promise about your payout timing.
The rule and the system want opposite things
A consistency rule is simple. It caps how much of your total profit any single trading day is allowed to be. If the cap is 30%, no one day can be more than 30% of what you have made. Firms use it to stop a trader from passing an evaluation on one lucky gamble.
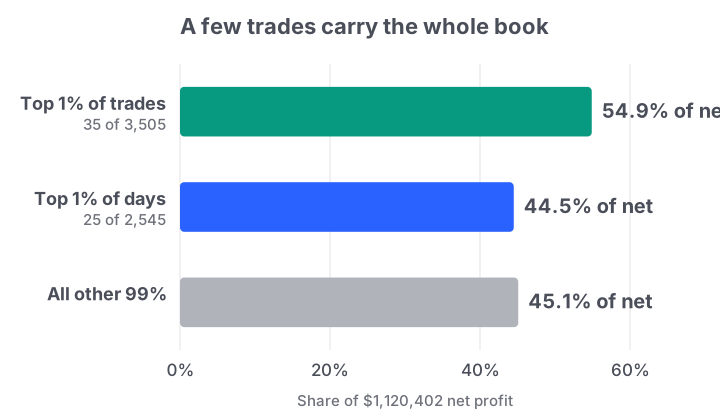
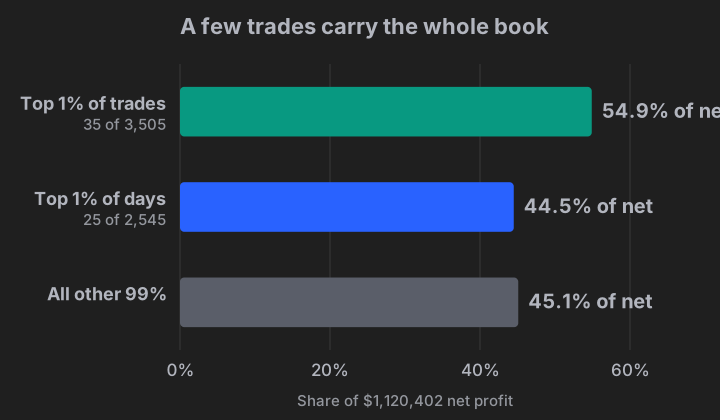
A momentum system is the opposite by design. It loses small and often, then wins big and rarely. The edge lives in the right tail. On the STS NQ book, the top 1% of trades, just 35 of 3,500, made 56.1% of all net profit. The top 1% of days made 45.3%. Strip out the best 5% of trades and the rest of the book is net-negative in aggregate. That is also why sitting a signal out is expensive: we measured what skipping trades after a loss costs, and even the gentlest rule we tested gave up four of the book's biggest winners.
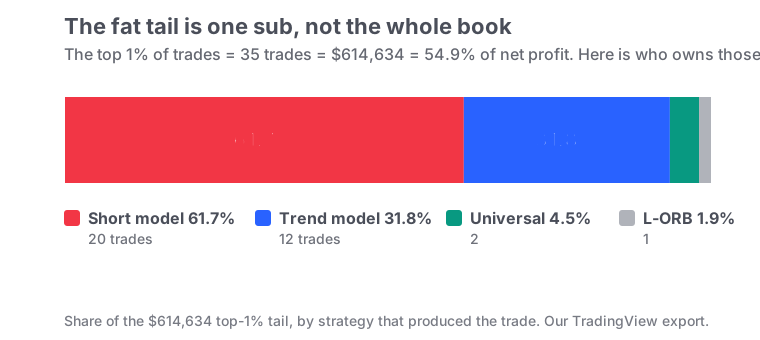
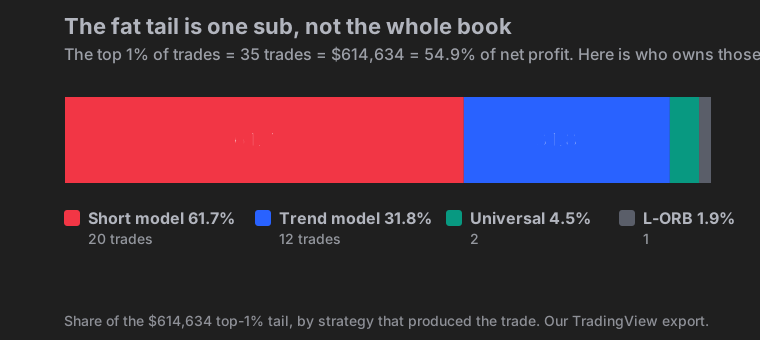
That tail is not spread evenly across our five strategies. One sub owns it. Of the 35 trades in the top 1%, our Short model holds 20 of them and 61.5% of the tail dollars, and our Trend model holds another 12. Two subs supply 32 of the 35 tail trades and 93.7% of the tail money. So the concentration is not a book-wide accident. It traces to one strategy whose winners are the largest in the whole book. Cap the biggest day and you are mostly capping that one sub's best days.
So the tension is structural, not bad luck. The rule caps the tail. The tail is where the money is. Whether that tension actually bites depends on one thing: how long the measurement window is.
The shorter the window, the more the cap bites
Here is the load-bearing number. We took our daily profit series and measured, over four window lengths, what share of the window's profit came from its single best day. Then we counted how often that share crossed a 30%, 40%, or 50% cap.
| Eval window | Median best-day share of window profit | 30% cap binds | 40% cap binds | 50% cap binds |
|---|---|---|---|---|
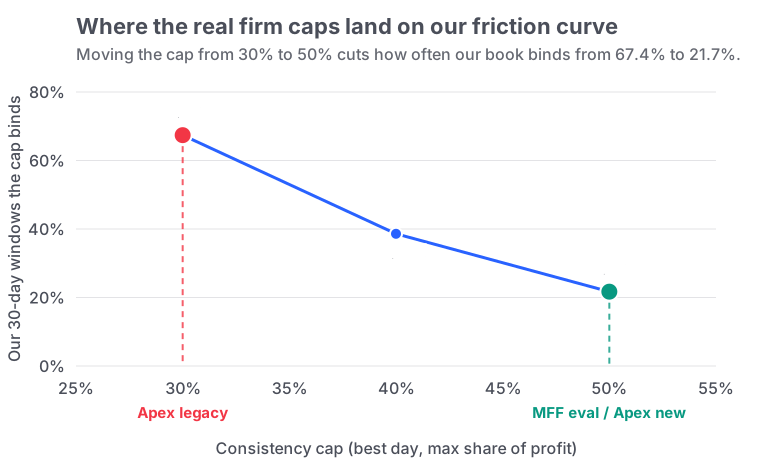
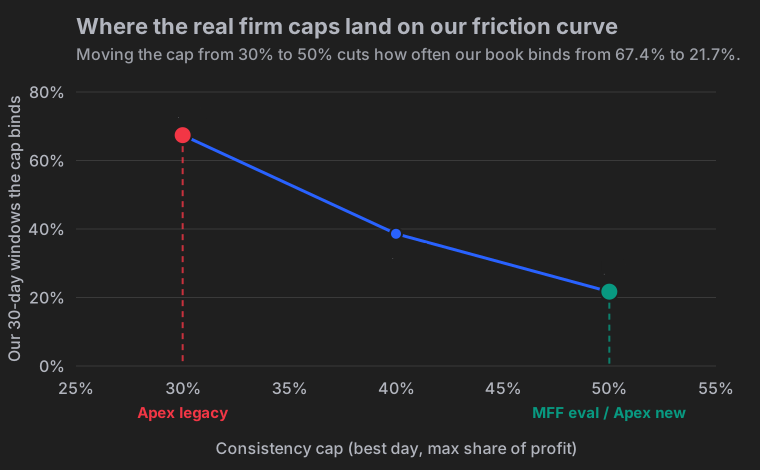
| 30 calendar days (payout-cycle length) | 35.7% | 67.4% of windows | 38.6% | 21.7% |
| 60 calendar days | 23.2% | 24.4% of windows | 6.3% | 0.8% |
| Full calendar year (14 full + 2 partial) | 6.7% | 0 of 14 full years (both partial stubs also clear) | 0 | 0 |
| Full 15-year record | 4.0% (single best day) | never | never | never |
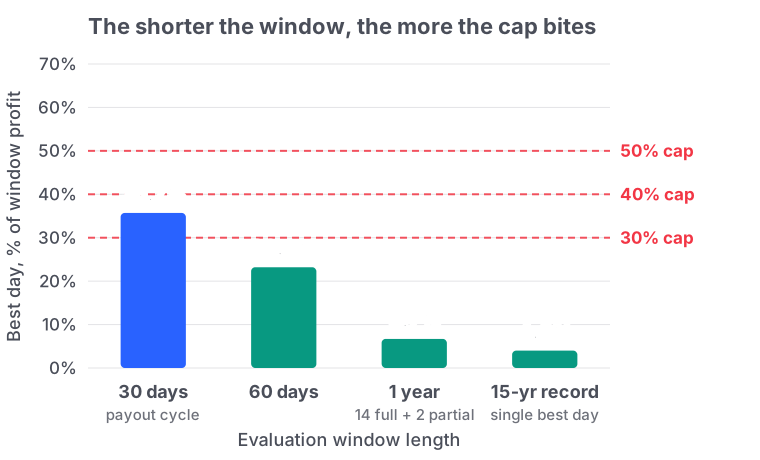
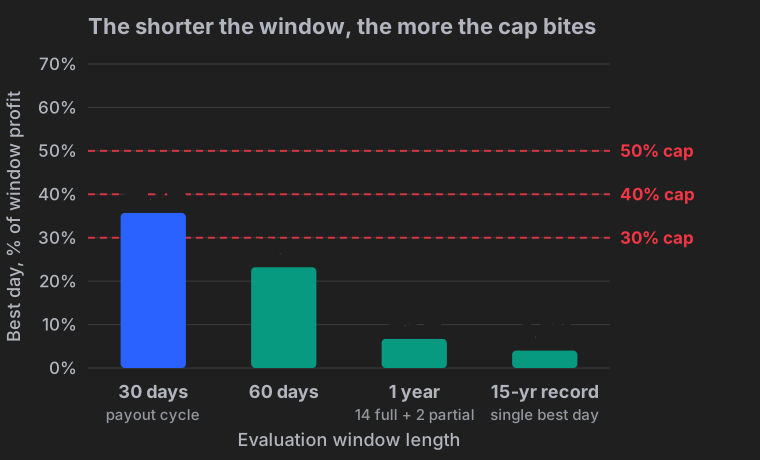
Read the table top to bottom and the pattern is clean. 35.7%, then 23.2%, then 6.7%, then 4.0%. The longer the window, the smaller one day's share, because more big days land inside a long window and average each other out. On the full 15 years, our biggest single day, $44,720 on 2024-12-18, is 4.0% of total profit. It would sail under any consistency cap ever written.
But a prop firm does not measure you over 15 years. It measures you over a payout cycle, which is usually about a month. And over 30 days our book is lumpy. In two thirds of those windows the best day is more than 30% of the window's profit.
That is not a flaw in the book. It is the book working as designed, viewed through a short lens.
Window length is not the only thing that moves the bind rate. Market volatility does too, and in the direction that hurts most. We split every 30-day window by the trailing volatility of NQ as of its end day, high-vol versus low-vol at the median. In high-vol windows a 30% cap binds 75.5% of the time. In low-vol windows it binds 59.0%. That is a 16.5 point spread.
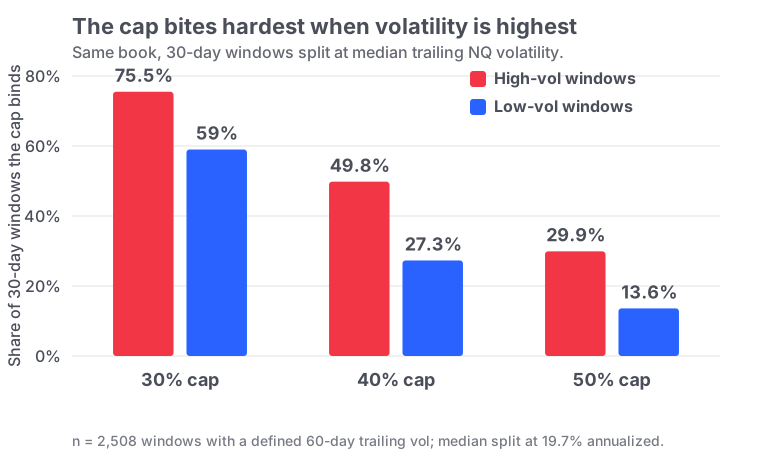
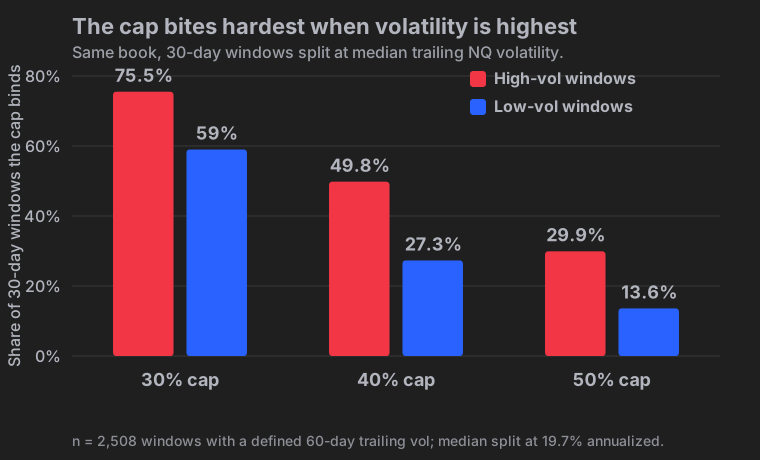
That is the cruel part. The cap bites hardest in the same regime that makes your best months. When NQ moves, your big days get bigger, and the rule notices the big day, not the good month.
Two thirds of 30-day windows break a 30% cap
The bind rate is the number that decides whether you feel the rule, so start with the full shape. Across every rolling 30-day window, here is where the best day's share of window profit lands. The median is 35.7%, but the spread is wide, and two thirds of windows fall to the right of the 30% cap line.
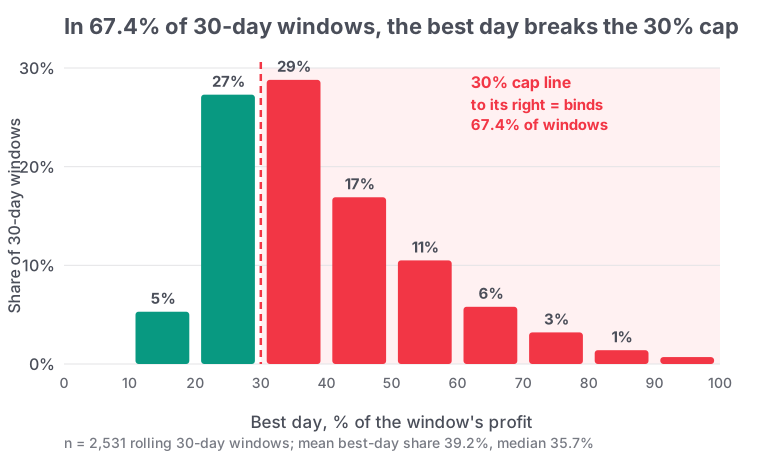
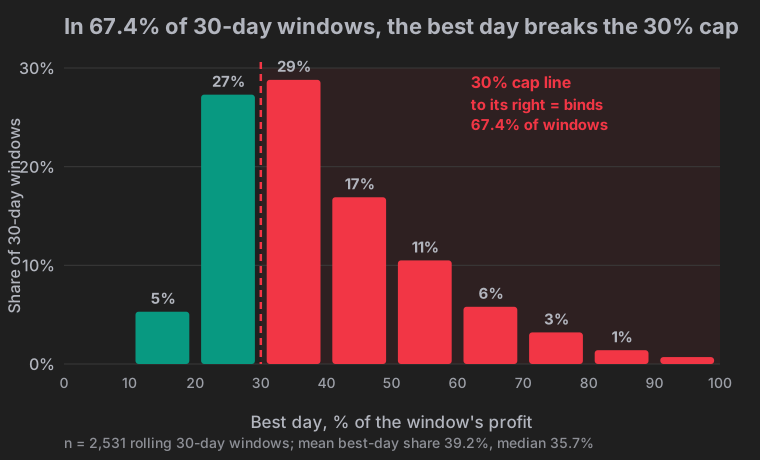
This is not an artifact of one lucky ordering of trades. We block-resampled the trade sequence 1,000 times, keeping the winning and losing streaks intact, and re-measured the bind rate each time. Even in the worst 2.5% of those resamples, a 30% cap still binds in at least 71.3% of 30-day windows. Resampling never makes the cap look comfortable. The resampling itself nudges the rate upward by clustering streaks, so we hold 67.4% as the headline and use the bootstrap only to show the result does not depend on one lucky ordering.
Two levers move this rate, and both point the same way. Raising the cap from 30% to 50% cuts the bind rate to about a third as often. Stretching the cycle from 30 days to 60 takes a 30% cap from binding two thirds of the time to under a quarter. Longer cycles and higher caps are kinder to a fat-tailed book, and by a lot.
This is also why the rule is a friction, not a verdict. Binding does not mean you failed. On most firms it means you keep trading until your total profit grows enough that your best day falls back under the cap. You give up nothing but time. But time is the cost that a big-day system pays over and over, because its next big day just resets the problem.
The real rules sit between 30% and 50%
Rules change often, so every number here is dated 2026-07-03 and must be re-checked on the firm's own page before you act. We are not affiliated with any prop firm, and this is rule-difference analysis, not a ranking.
MyFundedFutures (official help center, captured 2026-07-03) sets the consistency rule at 50% for all evaluations on its Rapid, Flex, and Pro plans. Their wording: "no single day's profit should exceed 50% of your total evaluation profits made." Their formula is "Total profit target / 2 = Max Daily Profit." On a 50k evaluation with a $3,000 target, the most any one day can be is $1,500. Going over does not breach the account; you simply keep trading additional days until the requirement is met.
Apex Trader Funding (WebSearch snippets, 2026-07-03, help page returned 403 to direct fetch, so treat as secondary and re-verify) has run a 30% legacy rule at payout: "no single trading day accounts for more than 30% of the total profit balance at the time of a payout request," with the formula "Highest Profit Day / 0.30 = Minimum Total Profit Required." Snippets indicate Apex relaxed this from 30% to 50% on 2026-03-01 for new accounts, with legacy accounts keeping 30%. Confirm the current number on Apex's own page before relying on it.
So across two of the larger firms, "consistency" means a best-day cap somewhere between 30% and 50%. Our data says that band is exactly the range where a monthly-measured momentum book flips from mostly-binding to sometimes-binding.
A copy-paste check for your own book
You do not need our data to see whether a cap will bite you. You need two numbers: your single best day and your running total profit. The firms publish the arithmetic.
Minimum total profit you need = your single best day / cap.

  30% cap (Apex legacy):   best day / 0.30
  50% cap (MFF eval, Apex new): best day / 0.50   (i.e. total target / 2 = max day)

If your running total is below that number, the cap binds:
you must keep trading until the total catches up.
Plug in a $2,000 best day against a 30% cap: you need $6,667 total profit before that day is "consistent." Against a 50% cap you need $4,000. If your system makes its money in bursts, run this against your biggest realistic day, not your average one, because the cap is set by your best day, not your typical one.
The honest limit
Our daily profit books each trade on its exit date, when the profit is actually realized. That is one defensible convention, not the only one. If we book each trade on its entry date instead, the 30-day median best-day share drops from 35.7% to 32.8%, and the 30% bind rate falls from 67.4% to 59.2%. Same direction, slightly softer. We report the exit-date version as our primary because that is when a prop account's balance actually moves.
The bigger limit is the one from the top. This is the shape of our book, not a prediction about yours. A trader copying our signals trades different size, pays different costs, and may skip days we take. Their per-day distribution is their own. What we are confident transfers is the diagnosis: a fat-tailed system and a short-cycle consistency cap are structurally opposed, and the fix is never a trick. It is a longer cycle, a higher cap, or clear eyes about how many extra days the rule will cost you.
Pick the cap and cycle before you pick the firm
Here is the one thing to do differently before your next evaluation. Run the check above on your biggest realistic day, then choose your firm on two terms above all others: a higher cap and a longer payout cycle. Expect the rule to cost you extra trading days, not your account. That turns a consistency rule from a threat into a scheduling problem. Extra days cost money on a monthly-fee combine, which is the arithmetic in combine reset math.
Because the rule is not measuring whether your system works. It is measuring whether your profit is smooth on a monthly timescale, which a momentum book is not, and which is a separate question from whether the edge is real.
This is the profit-side companion to the risk-side problem. A trailing drawdown punishes how deep your dips get, and on this book those dips run deeper and longer than most traders budget for, which is how long our drawdowns actually last. A consistency rule punishes how tall your peaks get. Same book, two rules, both testing the shape of your returns rather than the size of them. The same short-window-versus-long-run distortion is why a live drawdown usually runs deeper than the backtest: a short lens on a lumpy series makes the lumps look larger. If you want the numbers that back the concentration figures here, they are in our five NQ strategies and on the tear sheet. The signals themselves, the entries that produced this trade list, are the one thing we sell.
How we measured this
Instrument: CME E-mini Nasdaq-100 (NQ). Data: the TradingView list-of-trades export from our five-strategy intraday book, 3,500 trades, first exit 2011-08-11, last exit 2026-08-05, $100,000 starting capital, no compounding, one to three contracts scaled by volatility, commissions and slippage included, $1,112,232 net.
Method: we build a daily profit series by booking each trade's net P&L on its exit date, the day it is realized. "Best-day share of window profit" is the largest single-day profit in a window divided by the sum of the positive days' profit in that window. Windows with no profit are excluded. Rolling windows are trailing calendar-day periods, full-window only, so every window is a true 30 or 60-day span (2,531 and 2,517 windows). These windows overlap heavily, so 2,531 is the number of windows, not independent observations; the record holds about 182 non-overlapping 30-day blocks, and the bind rate on those independent blocks is 68.1%, essentially the same. A cap "binds" when the best-day share exceeds it. Per-year and full-record figures use the same best-day-over-profit-sum ratio. The tail-concentration figures sort trades and days by net profit and cumulate the top 1% and 5%.
One choice to flag, because it is the number a skeptic should attack first: our denominator is the sum of positive days, not net profit after losing days. The firms' own wording is "total profit made" (MFF) and "total profit balance" (Apex), which is net. Net is a smaller denominator, so a literal reading of the firm rule would make the best day a larger share and bind more often, not less. We use the positive-days sum because it is the more conservative choice and does not let a single bad losing streak inside a window inflate the share. Read our bind rates as a floor.
We cross-checked every book figure three independent ways: a dedupe-by-trade-number pass on exit dates, a separate exit-row-only parse, and a PowerShell Import-Csv leg. All three reconcile to 3,500 trades, $1,112,232 net, 2,540 trading days, best day $44,720 on 2024-12-18. The entry-date sensitivity above is the same pipeline rebuilt on entry dates. Prop-rule figures are dated captures: the MyFundedFutures 50% rule is a direct help-center fetch (2026-07-03); the Apex figures are WebSearch snippets (2026-07-03) because the help page blocked direct fetching, and they are flagged as needing re-verification.
Three added tests back the sub attribution, the robustness band, and the volatility split, each two-way reconciled. Sub attribution maps every trade to the strategy on its entry signal, then buckets the top 35 trades: the Short model holds 20 of them and $383,550, which is 61.5% of the $624,004 tail. The robustness band is a moving-block bootstrap, 1,000 resamples of 20-trade blocks that preserve streaks, with the reattached calendar; the 30% bind rate never drops below 71.3% in the worst 2.5% of resamples. The volatility split labels each window by trailing 60-day annualized NQ realized vol from the export's own price column, then splits at the median (19.7%). That vol proxy is self-contained, not our canonical regime map, which does not cover the full export, so read the direction, high-vol binds harder, as the finding rather than the exact 75.5 versus 59.0 pair.
What would change the numbers: a smoother return stream with less day-to-day concentration would lower every bind rate. A shorter payout cycle, or a lower cap, would raise them. All of this is hypothetical backtest performance, and prop rules change; re-check both before acting.
STS Research. Educational content, not investment advice. We trade this book live and sell access to its signals; judge the data accordingly. We have no affiliation with MyFundedFutures, Apex, or any prop firm, and rules cited here were captured on 2026-07-03 and can change at any time.
CFTC Rule 4.41: Hypothetical or simulated performance results have certain limitations. Unlike an actual performance record, simulated results do not represent actual trading. Also, since the trades have not been executed, the results may have under- or over-compensated for the impact, if any, of certain market factors, such as lack of liquidity. Simulated trading programs in general are also subject to the fact that they are designed with the benefit of hindsight. No representation is being made that any account will or is likely to achieve profit or losses similar to those shown.
Past performance is not indicative of future results.