NQ vs MNQ: Which Nasdaq Futures Contract Should You Trade?
The MNQ vs NQ decision comes down to one question: how big do you want each point to be? MNQ is the same trade as NQ at one tenth the size. One NQ point is worth $20. One MNQ point is worth $2, exactly a tenth, so ten MNQ equal one NQ. That is the conversion, and it holds on every spec: point, tick, and total move. If NQ feels too big for your account, MNQ is the honest fix: same market, same hours, 90% less dollar risk.
The catch is cost. A round-turn fee is a fixed dollar amount per contract, so it eats a much bigger share of each micro trade. Match one NQ with ten MNQ for the same exposure (the same dollars per point) and you pay about ten times more in commission for the identical position. That tradeoff, cheaper to size down but more expensive per dollar of edge, is the whole decision.
How many MNQ equal one NQ? Exactly ten
Ten. One NQ is ten MNQ, and there is no rounding in it. NQ and MNQ track the same index, trade the same hours, and move at the same time. The only difference is the multiplier.
| Spec | NQ (E-mini) | MNQ (Micro) |
|---|---|---|
| Point value | $20.00 | $2.00 |
| Tick (0.25) | $5.00 | $0.50 |
| 100-point move | $2,000 | $200 |
| Relationship | 1 NQ | = 10 MNQ |
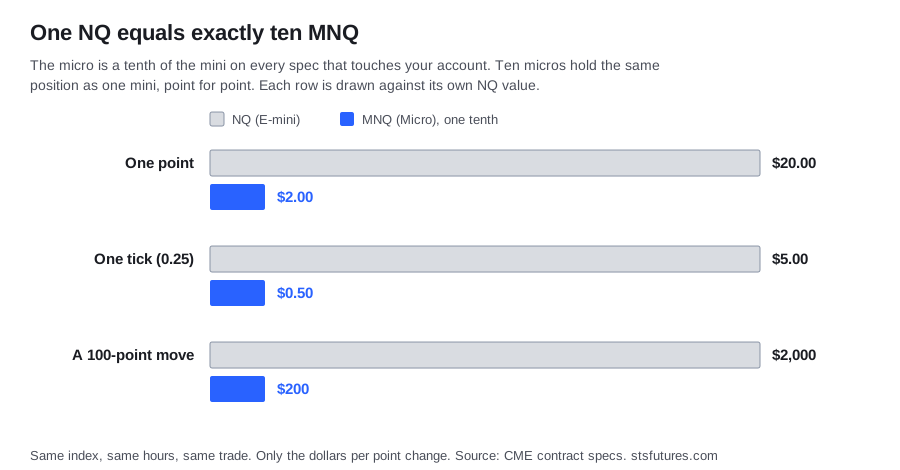
That is the entire spec story. MNQ is one tenth of NQ in every dimension that touches your account. Ten micros equal one mini, point for point. So the choice is never about which market is better. It is about how much money you want each point to be worth. To turn any point or tick move into dollars on either contract, use our NQ and MNQ point value calculator.
A reader new to this usually asks: is MNQ "worse" than NQ? No. It is the same thing in a smaller cup, on the same exchange, deeply traded in its own right. Nothing about the micro is second-class except the size. The reason micros exist is access. They let a smaller account trade the index without a single bad day wiping it out.
Whose trades are these (read this first)
Quick context so the numbers below make sense. These numbers come from our own book: five systematic NQ strategies run as one single-position portfolio. TradingView backtests, 2011 to 2026 (data as of August 5, 2026), one to three contracts scaled by volatility, commissions and slippage included, $1,112,232 net on the NQ mini. The style is momentum and trend continuation, intraday plus one overnight model. Not mean reversion, not scalping.
That matters here in one specific way. The dollar figures below (average trade, worst drawdown) are our system's results on NQ. We then scale them to MNQ by dividing by ten, because the contract is exactly a tenth. The contract specs and the fee math are true for any trader. Our P&L numbers are ours. What transfers to you is the method: work out the fee drag on your average trade and the dollar risk your size carries, then pick the contract that fits your account.
The catch: fees are a bigger slice of a smaller trade
Here is the part the spec sheets skip. Commissions are charged per contract, and they do not shrink when the contract shrinks. Slippage shrinks (a tick is $0.50 on MNQ versus $5.00 on NQ), but the commission does not.
Our commission is $2.05 a side, about $4.10 a round turn per contract. Here it is for each:
- NQ: about $4.10 round turn
- MNQ: about $4.10 round turn, essentially the same
Notice MNQ's fee is not one tenth of NQ's. It is roughly the same $4.10, not $0.41, because commission is per contract, and the contract count, not the contract size, sets the fee.
Our average trade across 3,500 NQ trades made $318. On one NQ, the $4.10 round turn is 1.3% of that. Now size the same exposure with ten MNQ. You pay the round turn ten times: $41.00. Against the same $318 of profit, that is 12.9% of the trade gone to fees. Same position, about ten times the fee drag, because the commission never shrank.
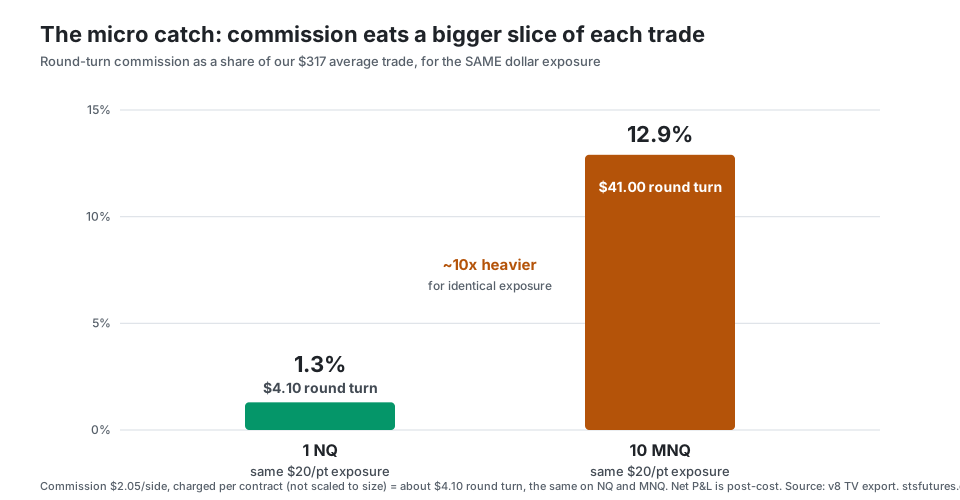
The percentage is the same whether you hold one micro or ten. Trade just one MNQ and it makes about one tenth of our average trade, roughly $32. The $4.10 fee against $32 is, again, 12.9%. It is the same share from a smaller trade, not a new cost, because it is baked into the per-contract commission. So the micro trader pays a bigger share of each dollar of edge to fees than the mini trader does. But a bigger share of a much smaller trade is still small dollars. That is the point of the next section.
So the honest read on "10 MNQ instead of 1 NQ" is that the commission really is about ten times heavier for the same exposure, because commission is per contract and each of the ten micros pays it. (That rides on our modeled fee. Cheaper micro commissions at your broker narrow the gap, but the direction never flips: per-contract fees fall hardest on the micro trader.) Worth knowing before you assume micros are just a cheaper copy.
The upside: one tenth the dollars at risk
Now the reason micros are worth that fee. They cut your dollar risk by 90%, cleanly.
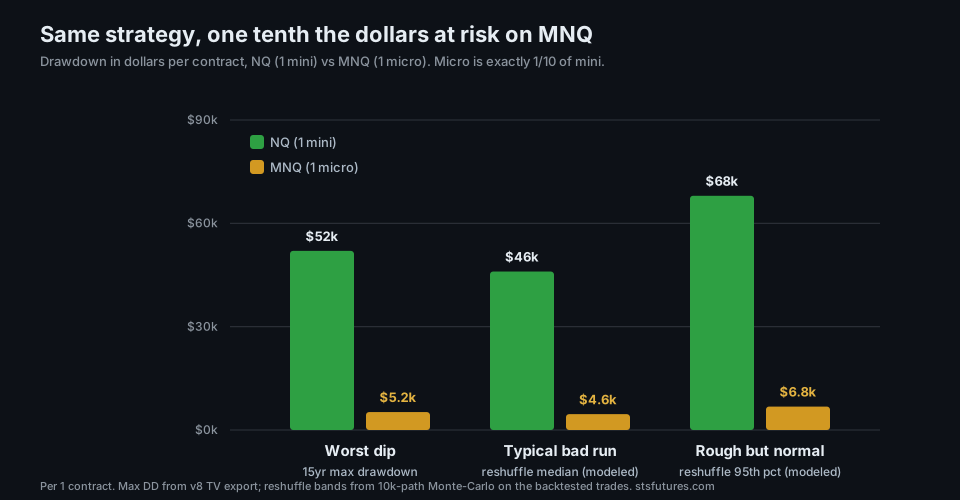
Our worst drawdown on one NQ over 15 years was $51,836. On one MNQ that same run would have been about $5,184, a tenth. Every dollar risk number scales the same way. We also reshuffled our backtested trades thousands of times (a Monte-Carlo) to see how that ordering compares with others. On one mini, the typical reshuffled run drew down around $46,000, less than the backtest produced, and one ordering in twenty ran past $68,000. Divide by ten for the micro. Depth is only half of it: how long each drawdown in our book kept us underwater is timed in how long trading drawdowns last.
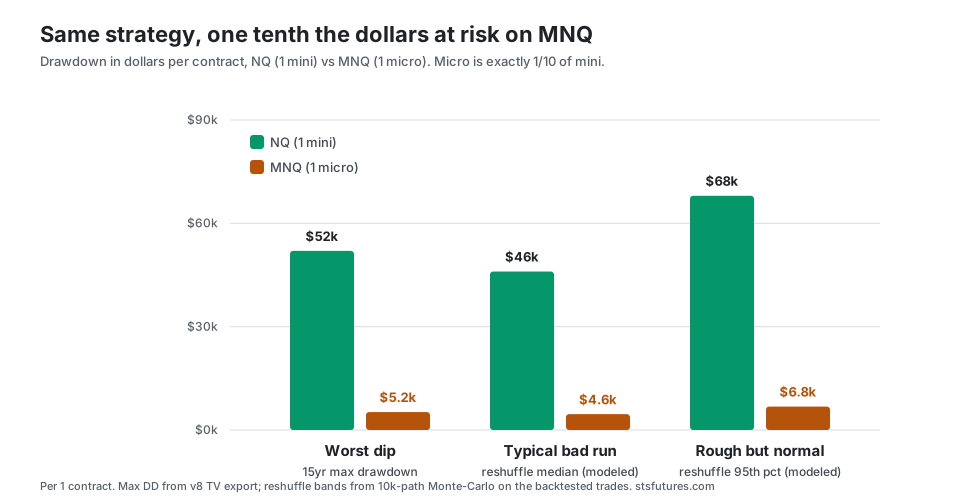
This is why account size, not preference, usually picks the contract. A drawdown that demands a five-figure cushion on NQ becomes a four-figure cushion on MNQ. If a $46,000 swing would force you to quit at the worst moment, the mini is too big for you. Hold the micro and the same drawdown is one tenth as scary. The best contract is the one whose worst day you can survive. We worked the full capital ladder in the NQ account-size reality check.
Pick the contract by the dollar drawdown you can stomach, not by the per-trade fee. MNQ costs about ten times more in commission for the same exposure, but it cuts your worst-case dollar risk by 90%. For most accounts under roughly $25,000, that trade is worth it. Sizing you can hold beats a slightly cheaper fill you can't.
Which should you trade, NQ or MNQ?
Put the two forces together and the answer falls out.
Trade MNQ if your account is small enough that one NQ's drawdown would scare you out of the strategy. That is most newer or smaller accounts. There is also a harder gate than comfort: brokers require far more margin to hold one NQ than one MNQ, so a small account is often steered to the micro whether it likes the fee or not. The extra fee drag is the price of a position you can actually hold through a bad month. A position you bail on at the bottom costs far more than that extra $37 in fees.
Trade NQ if your account is large enough to ride a five-figure drawdown without blinking, and you want fees to be the smallest possible share of each trade. At that point the 1.3% drag beats 12.9%, and one clean fill beats ten.
Mix them to size between the two. Because 1 NQ equals 10 MNQ, you can step from "1 micro" up to "1 mini" in ten even rungs of $2 a point, instead of jumping straight from $0 to $20 a point. That granularity is the underrated reason to keep micros in the toolbox even on a funded account.
Either size trades the same entries. Our NQ futures signals fire once and you take them on the mini or on ten micros, at one tenth the dollars.
One more real-world note. Many prop evaluations have tight trailing drawdown limits, and a normal losing run on this strategy can be larger than people expect. We size that losing run in what a $25k account can actually hold. The short version: even one micro carries real variance, so size for the limit, not for the dream.
How we measured this
Instrument: CME Nasdaq-100 E-mini (NQ) and Micro E-mini (MNQ). The point values ($20 and $2) and tick values ($5.00 and $0.50) are the public CME contract specs. MNQ is defined as exactly one tenth of NQ, so all of our NQ dollar figures scale to MNQ by dividing by ten. That scaling is on gross P&L and dollar risk; a single micro still pays the full, undivided commission, so its net average trade lands a few dollars under one tenth of the mini's, which only sharpens the point that commission does not shrink.
Our book data: our live five-strategy intraday NQ book, backtested on TradingView, 2011 to 2026 (data as of August 5, 2026), 3,500 trades, $100,000 starting capital, no compounding, commissions and slippage included. From it we take the average trade ($318), the average win ($1,979), and the maximum drawdown ($51,836). The reshuffled drawdown bands ($45,379 median, $67,838 at the 95th percentile for the 1 to 3 contract vol-scaled book) come from a 10,000-path Monte-Carlo reshuffle of those same backtested trades.
Costs: our net P&L is post-cost. The observed round-turn cost is about $4.10 per contract, effectively all commission ($2.05 a side); modeled slippage is negligible on our fills, so the cost that matters is the per-contract commission, which does not shrink for a micro. Real-world fees vary by broker and volume, and micro commissions are often a little lower than mini, so treat $4.10 as a representative round turn, not a quote. The point we are making, that commission is charged per contract and so does not shrink with the contract, holds at any reasonable fee schedule.
The limit to keep in mind: the dollar P&L and drawdown figures are our system's, on NQ, scaled to MNQ by the contract ratio. They are not a forecast and not a property of the market itself. The fee math and the specs are universal; the performance numbers are ours, and they are hypothetical backtest results. Past performance does not indicate future results.
What to do with this
Before you pick a contract, do two quick sums on your own trading. First, take your average winning trade and divide your broker's round-turn fee into it. If that fraction is uncomfortably large on micros, you now know the real cost of sizing down. Second, take the worst drawdown you have actually lived through, or a realistic estimate, and ask whether you could sit through it at NQ size without quitting. If the honest answer is no, you want MNQ, and the fee is just the toll. How wide a stop to give either contract is measured in NQ stop loss: how many points?, and how far a typical session moves is in NQ and ES average daily range.
The strategy does not change between the two contracts. Only the dollars do. Our NQ signals are the same entries whether you trade them on NQ or on MNQ at one tenth the risk. The full performance picture, drawdowns and all, is on the strategy page and the tear sheet. If you are weighing the index itself against the S&P, see NQ vs ES futures for the same pick-your-dollars-per-point logic, applied to a different index. And if the plan was to hold ES alongside NQ to spread the risk, read why NQ and ES are 0.93 correlated first. Sizing down to the micro is a real risk cut; adding a correlated second contract is not. Plans are on the pricing page.
We trade this book live and sell access to the signals, so judge the data accordingly. This article is educational and is not investment advice. Futures trading involves substantial risk of loss and is not suitable for every investor.
Hypothetical performance disclaimer (CFTC Rule 4.41): hypothetical or simulated performance results have certain limitations. Unlike an actual performance record, simulated results do not represent actual trading. Also, since the trades have not been executed, the results may have under- or over-compensated for the impact, if any, of certain market factors, such as lack of liquidity. Simulated trading programs in general are also subject to the fact that they are designed with the benefit of hindsight. No representation is being made that any account will or is likely to achieve profit or losses similar to those shown. Past performance does not indicate future results.