NQ account size: what can a $25k account actually hold?
The STS NQ book, run at its full mini-scale sizing, draws down past a $25,000 account 100% of the time. That is out of 10,000 Monte Carlo reshuffles of the STS 15-year backtested record (3,500 backtested trades, 2011 to 2026, traded as a one-to-three-contract cascade that averages 1.81 contracts). That same book needs about $68,000 to hold a bad-but-normal (95th-percentile) drawdown, and about $81,000 to hold a rough (99th-percentile) one. So the honest answer to "can I run this book at full mini scale on $25k?" is no. Not this book, not at that size.
That is the whole article in three numbers. The rest is the proof, the fix for small accounts (run the same book on micros), and a sizing rule you can copy.
These buffers belong to one specific book
Every number below comes from one specific place: our NQ book, five systematic strategies (S1, S2, S3, S5, S6) trading as one single-position account from 2011 through 2026, backtested in TradingView at one to three volatility-scaled contracts (it averages 1.81 contracts per trade). When we say "full mini scale" we mean that book as it actually traded, in NQ minis, not a hypothetical steady one-lot. These are momentum and trend-continuation entries, intraday plus one overnight sub, not mean reversion and not scalping. The drawdown distribution you are about to see is a property of that trade mix and that sizing. A book that trades a different style, a different size, or a different instrument has its own distribution and its own buffers.
So take the method, not the exact dollars. If you trade NQ discretionarily, the rule that transfers is this: size against the reshuffled drawdown distribution, not against the single realized drawdown you happened to live through. The specific figures here, like the $6,784 per-micro 95th-percentile buffer derived below, are ours. Yours will differ. The way to find them is to run the same reshuffle on your own trade record.
One sleeve drives most of the small-account drawdown
The buffer is not shared equally across the five strategies. We ran a leave-one-out test: drop each sub, re-run the 10,000-path Monte Carlo, and measure how the 95%-case drawdown of the full book changes.
Removing the Trend sleeve (S1) cuts the 95%-case drawdown by $6,543, the single largest effect of any sub. Trend is the main engine of the drawdown that drains a small account. The Overnight (S5) and Universal (S6) sleeves run the other way: dropping either one raises the drawdown, by $1,667 and $956, so they are net drawdown-dampers, not drivers.
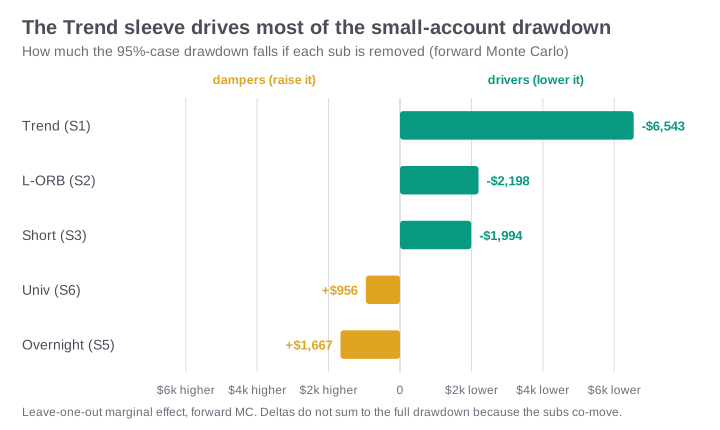
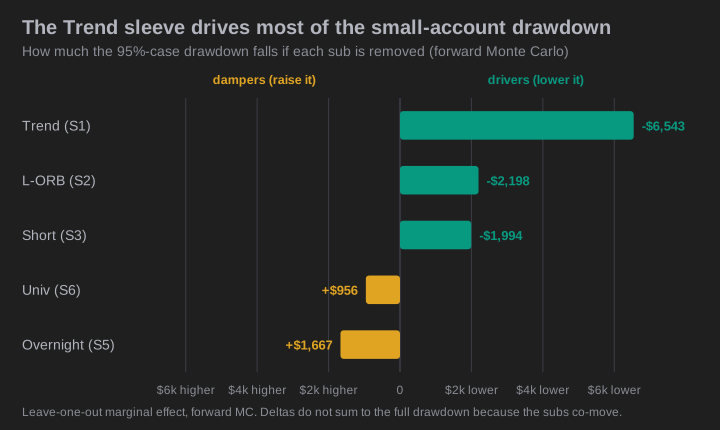
One honest note on lenses. In the single backtested 15-year path, dropping Overnight actually lowered the realized drawdown, because its trades happened to land inside the one worst dip in the backtest. Across 10,000 reshuffled orderings it damps the drawdown instead. The reshuffle is the decision-relevant lens here, the same reason we size against the distribution and not the one realized path.
The survival table: size against capital
We took our backtested 3,500-trade portfolio, reshuffled the order of those trades 10,000 times, and measured the worst peak-to-trough drawdown of each reshuffled path. Then we asked one question for every account size and every position size: how often is that drawdown bigger than the money in the account?
That fraction is how often an ordinary reshuffled drawdown would have swallowed the whole account over the 15-year path. It is a full-path max-drawdown exceedance, not a time-to-ruin or blow-up-this-year probability. Here it is.
The bottom row is the book at full mini scale (its one-to-three-contract cascade). Each micro row is that same book run at a fraction of mini size: since one MNQ micro is exactly one tenth of an NQ mini per point, "k micros" means the identical cascade scaled to k/10 of full size.
| Position size | $10k | $25k | $50k | $100k | $165k |
|---|---|---|---|---|---|
| 1 micro | 0.1% | 0.0% | 0.0% | 0.0% | 0.0% |
| 2 micros | 33.3% | 0.0% | 0.0% | 0.0% | 0.0% |
| 3 micros | 95.2% | 0.8% | 0.0% | 0.0% | 0.0% |
| 4 micros | 100.0% | 9.3% | 0.0% | 0.0% | 0.0% |
| 5 micros | 100.0% | 33.3% | 0.1% | 0.0% | 0.0% |
| 6 micros | 100.0% | 65.5% | 0.8% | 0.0% | 0.0% |
| 7 micros | 100.0% | 89.3% | 3.4% | 0.0% | 0.0% |
| 8 micros | 100.0% | 98.0% | 9.3% | 0.0% | 0.0% |
| 9 micros | 100.0% | 99.7% | 19.4% | 0.0% | 0.0% |
| Full mini scale (10x a micro) | 100.0% | 100.0% | 33.3% | 0.1% | 0.0% |
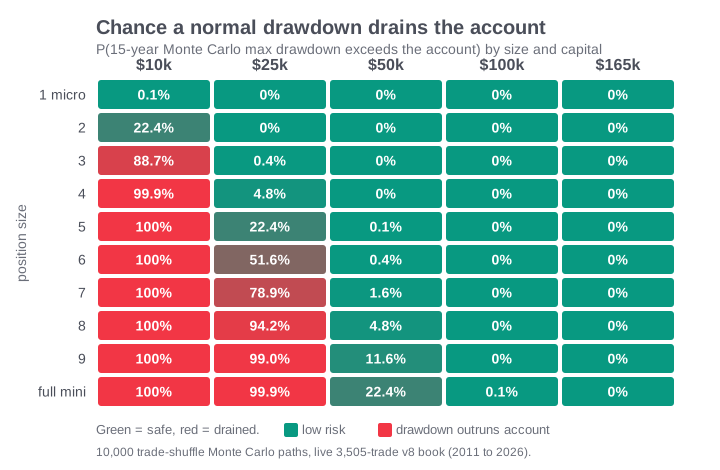
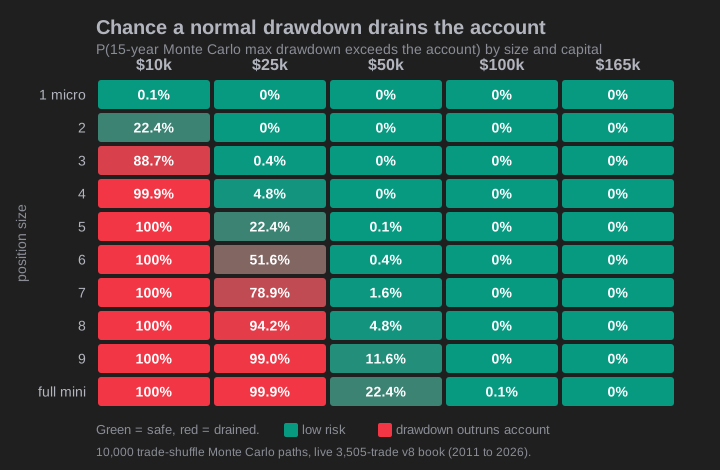
Read the bottom row. At full mini scale the book outdraws a $50k account better than one time in three (33.3%), and only turns green near $100k (0.1%). Read the top row. One micro is safe from $10k up. The account does not decide whether you make money. It decides whether a normal losing stretch closes you before the edge pays off.
Why the honest number is the Monte Carlo, not the single realized path
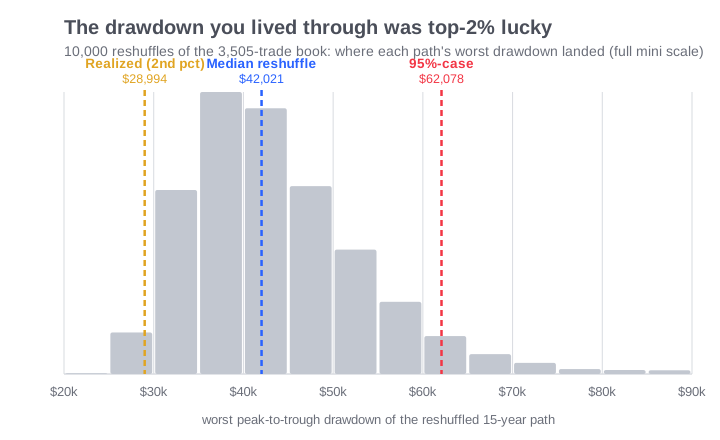
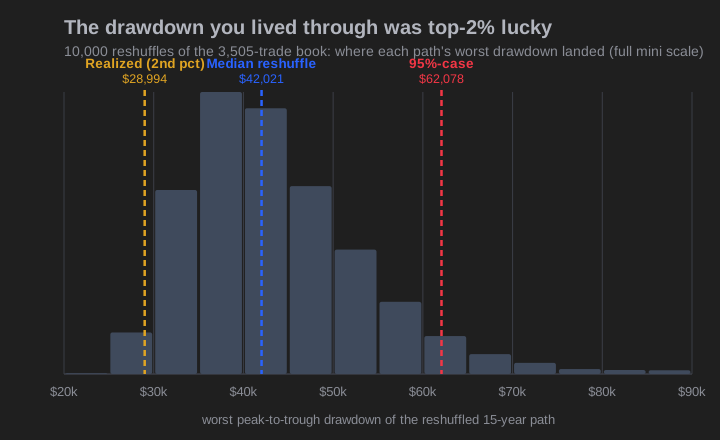
Our book's realized maximum dollar drawdown over 15 years was $51,836, which is 4.3% of the peak it fell from (our worst in percentage terms was a separate 20.4% episode). That is the number on the tear sheet. It is real. It is also the wrong number to size against.
Here is why. That $51,836 came from one particular order of wins and losses, the order history happened to deal us. When we reshuffle those same trades 10,000 times, the backtested $51,836 lands at the 72nd percentile of the drawdowns. In plain terms, the order we got was rougher than about seven in ten alternatives, and it is still nowhere near the worst the same trades can produce. The median reshuffle drew down $45,379, and the 95th-percentile reshuffle $67,838.
So if you size against the $51,836 you saw, you are betting the next 15 years never deal you anything worse than a 72nd-percentile ordering. One in twenty is worse by $16,000 or more. The drawdown you should plan for is the tail, not the path. This is the same reason a live drawdown almost always runs deeper than the backtest, and why we stress-test and reshuffle every result before we trust it. Size against the distribution, not against the one path you got.
Micros are how a small account holds the same edge
If the full-scale book needs about $68k, a $10k or $25k account is not shut out. It just runs the same signals in a smaller instrument. NQ moves $20 per index point, MNQ moves $2, exactly one tenth (verified on TradingView's contract specs and cross-checked against the E-mini reference on Wikipedia). So running the identical cascade on MNQ micros instead of NQ minis divides every dollar, and every drawdown, by ten. Trading one tenth of full scale is one micro's worth of exposure.
That splits the sizing problem into small steps. Here is the same distribution, scaled per size.
| Position size | Median DD | 95%-case DD | 99%-case DD |
|---|---|---|---|
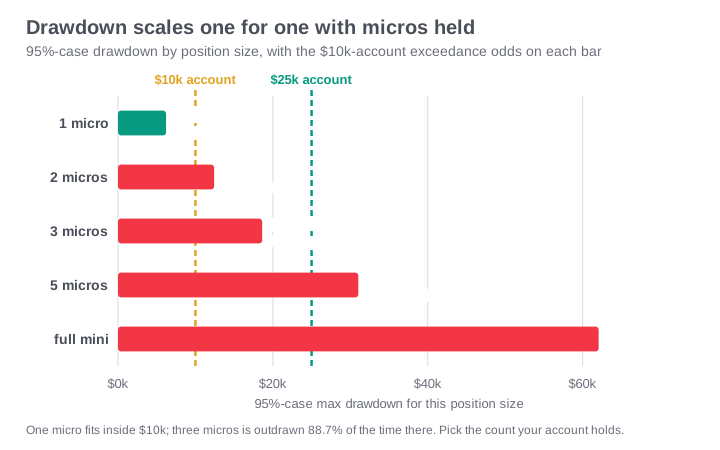
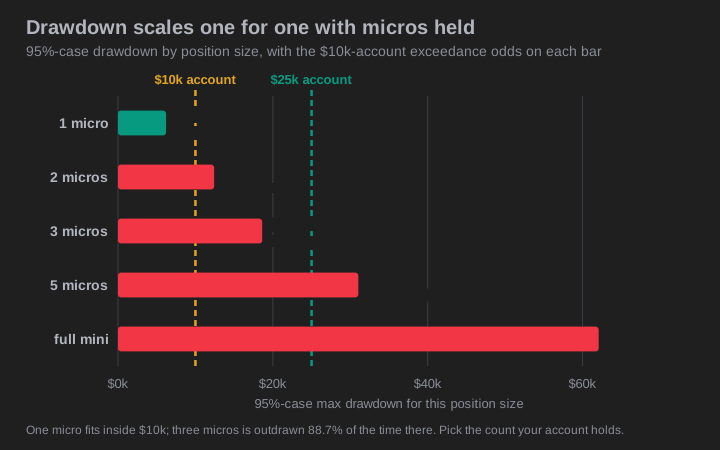
| 1 micro (1/10 scale) | $4,538 | $6,784 | $8,099 |
| 2 micros | $9,076 | $13,568 | $16,198 |
| 3 micros | $13,614 | $20,351 | $24,297 |
| 5 micros | $22,690 | $33,919 | $40,496 |
| Full mini scale | $45,379 | $67,838 | $80,992 |
One micro's bad-but-normal drawdown is about $6,784. A $10k account holds it with room, which is why the top row of the survival table is green. Step up to two or three micros and the drawdown grows in lockstep, so a $10k account starts to strain: it is outdrawn 33.3% of the time at two micros, 95.2% at three. The choice is not full-scale-or-nothing. It is how many micros your account can carry, and the answer to mini-versus-micro sizing is spelled out in NQ vs MNQ: which to trade.
The copy-paste sizing rule
Here is the rule we use, straight off the distribution above. Hold enough capital per contract to cover the 95%-case drawdown, or the 99%-case if you want more margin.
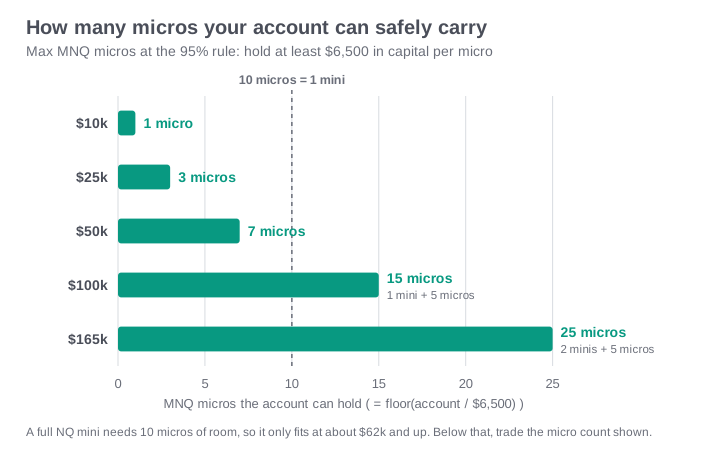
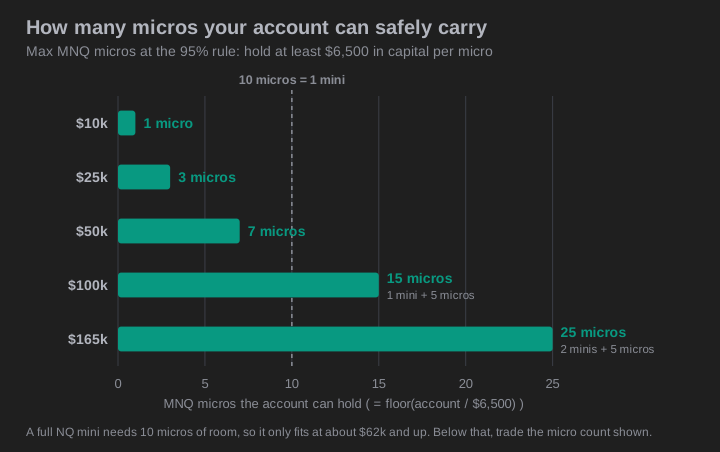
Per MNQ micro of exposure (one tenth of full mini scale): hold at least $7,000 to cover the 95%-case drawdown, or $8,500 for the 99%-case.
Full mini scale (ten micros): hold at least $68,000 for the 95%-case, or $81,000 for the 99%-case.
Max micros you can hold = floor(account ÷ $7,000) at the 95% rule, or floor(account ÷ $8,500) at the 99% rule.
Running the book at full mini scale only makes sense at roughly $68k and up.
Worked examples. A $25k account holds floor(25000 / 7000) = 3 micros at the 95% rule. A $50k account holds 7. A $100k account holds 14 micros, which is one full mini plus four. And a $25k account trying to run the book at full mini scale is asking for a position that needs $68,000 of room to live in a $25k box, which is exactly the 100% cell in the table.
Two things this does not model
The Monte Carlo reshuffles the same 15 years of backtested trades. It measures sequence risk, the luck of the order wins and losses arrive in. It does not invent a market the book has never seen.
First, the reshuffle treats every trade as swappable in order. That is the standard trade-shuffle assumption, and it has a known blind spot: if losses in the backtested sequence cluster together, say a bad regime that stacks five losers in a row, shuffling can break up that cluster and understate the deepest drawdowns.
So we tested it directly. We re-ran the Monte Carlo with a moving-block bootstrap, which resamples the book in blocks of 20 consecutive trades and keeps every losing streak intact (our longest historical streak is 14 trades). If clustering deepened the drawdown, the streak-preserving version would run past our published buffer. It runs the other way. Keeping the streaks intact, the drawdown band comes in materially shallower than the simple shuffle at every percentile, so the $67,838 we size against stays the conservative figure. We are not publishing the streak-preserving figures to the dollar: re-running them moves the numbers by more than we are prepared to call reproducible, and the direction, not the decimal, is what the check is for. Every block length we tried, and a second bootstrap family, landed below the simple-shuffle number.
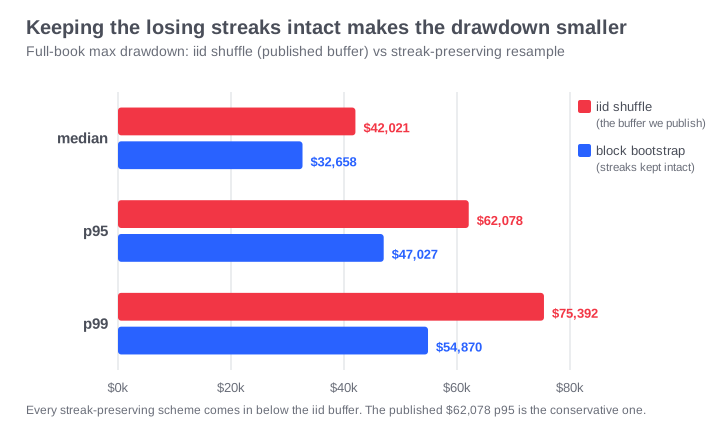
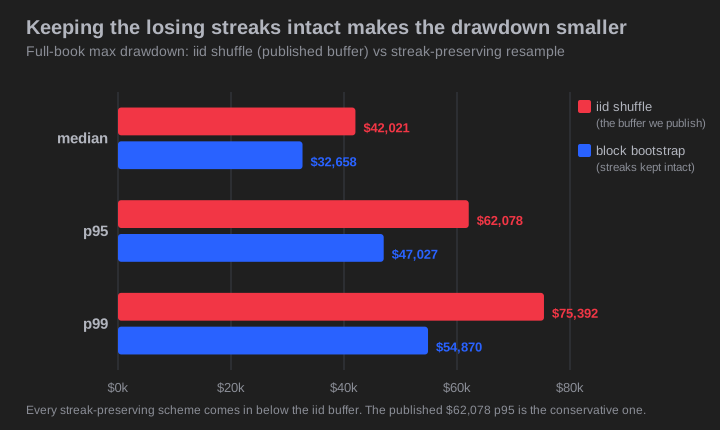
We lean conservative on purpose. The simple-shuffle buffer sits above the streak-preserving one, and above the drawdown the book actually realised, so the published numbers push the buffers up, not down. A book with heavier loss-clustering than ours should still trust its p99 line, not the median.
Second, a regime worse than anything between 2011 and 2026 sits outside this model entirely. The buffers here are a floor for behavior we have data on, not a promise. If NQ enters a stretch nastier than 2022 was for our overnight sub or 2015 was for our worst 14-trade streak, the real drawdown can run past the 99th percentile shown here. Treat these numbers as the minimum, and keep a margin past them.
Prop-firm accounts ask the same question
If you trade a funded account instead of your own cash, the survival math is identical. It just has a different name. A prop firm's trailing drawdown limit is an account buffer, and the question is still whether an ordinary losing stretch is bigger than the room you are given. The reason profitable traders fail evaluations so often is that their normal drawdown does not fit the buffer, and that normal drawdown is both deeper and slower than most people budget for: see expect a worse drawdown than your backtest and how long drawdowns last. Same distribution, same rule, smaller box. Buffers differ by firm and change without notice, so take the dollar figure from the firm's own current rulebook, then check it against your own drawdown in the prop-firm trailing drawdown calculator. What the whole attempt costs once resets are counted is a separate question, and we priced it in combine reset math. Some firms also cap how much of your total profit any single day may be, which bites a book like ours where a few days carry the record: the consistency rule versus a fat-tailed system.
What we test next
The obvious next step is regime-conditional sizing: instead of one buffer for all 15 years, compute the drawdown distribution inside high-volatility stretches versus quiet ones and size to the regime you are in. That would let a smaller account carry more micros in calm markets and fewer in storms, rather than holding one static buffer for everything. It needs a regime label we trust before we will publish a number on it, so for now the static buffers above are the honest floor.
The trades behind all of this live on the strategy page and the backtested tear sheet. If you want the signals that generated the 3,500-trade record we sized here, that is the one thing we sell.
How we measured this
Instrument: CME E-mini Nasdaq-100 (NQ), scaled to MNQ micros as mini dollars divided by ten. Data: our five-strategy intraday book, the single-position TradingView export, 3,500 trades from 2011-08-11 through the 2026-08-05 export, traded in NQ minis at its one-to-three-contract volatility-scaled cascade (mean 1.81 contracts per trade, so "full mini scale" is this book as traded, not a flat one-lot), commissions and slippage included in the backtest, $1,112,232 net. Method: shuffle the 3,500 realized per-trade net P&L values 10,000 times with a deterministic seed, take the maximum peak-to-trough drawdown of each cumulative path, and report percentiles. For each account-and-size cell, count the fraction of the 10,000 paths whose drawdown, scaled by the micros held, exceeds the account. We checked the distribution four independent ways. Five independent seeds moved the 95%-case buffer by under one percent, and a resample-with-replacement bootstrap reproduced the headline cells within about five percent. A streak-preserving moving-block bootstrap that keeps every losing run intact came in lower at every percentile, which tells us the simple-shuffle buffer we publish is the conservative one. And a fill-noise stress that perturbs every entry and exit by up to four ticks moved the 95%-case buffer by under 0.1%, so the $68k figure is not an artifact of exact fills. What this measures is sequence risk over a full 15-year path, not a first-passage time-to-ruin, and not a regime the book has not traded. What would change the numbers: a trade distribution with deeper peak-to-trough dips than ours, which would push every buffer higher.
STS Research. Educational content, not investment advice. We trade this book live and sell access to its signals; judge the data accordingly.
CFTC Rule 4.41: Hypothetical or simulated performance results have certain limitations. Unlike an actual performance record, simulated results do not represent actual trading. Also, since the trades have not been executed, the results may have under- or over-compensated for the impact, if any, of certain market factors, such as lack of liquidity. Simulated trading programs in general are also subject to the fact that they are designed with the benefit of hindsight. No representation is being made that any account will or is likely to achieve profit or losses similar to those shown.
Past performance is not indicative of future results. Futures trading involves substantial risk of loss and is not suitable for every investor.