NQ Futures Signals, Backtested: 15 Years, 3,500 Trades, Every One Public
Most NQ trading signals do not work, and almost none can prove it either way. The honest answer to "do they work" is: a real signal edge is rare, it is measurable, and the only way to trust one is a long, complete, statistically tested record with every trade shown. We publish exactly that. Our NQ signals come from a rules-based book backtested across 3,500 trades and about 15 years (2011 to 2026), with a net result of $1,112,232 on the NQ mini (1 to 3 contracts scaled by volatility) and every single trade posted on a public tear sheet. This page puts that record under the same tests a quant desk would use, so you can see what "signals that work" looks like up close, and how to tell a real track record from a screenshot.
Whose trades these are, and what a "signal" means here
These are the entries and exits of our backtested NQ book: five rules-based strategies running one position at a time on Nasdaq 100 futures. A signal is a specific instruction (enter, exit, direction, session), not a market opinion. The numbers below are hypothetical backtest results on the NQ mini, 1 to 3 contracts scaled by volatility, no compounding, the same engine that generates the live alerts. We trade this book and sell access to the signals, so read the data with that in mind and check it against the tear sheet yourself.
How the signals work, and how you get them
The five strategies each target a different market condition, so they rarely fire together: an early-session long, an opening-range breakout off the 9:30 open, an intraday trend model that trades both directions, an overnight (Globex) model, and a short-side model. Together they run as one diversified book that holds a single position at a time. The full breakdown of all five, with each equity curve, is on our strategies page.
Each alert is a complete instruction: entry price, direction, and the exit logic. It arrives in real time by email and on the live dashboard the moment a strategy fires, with no delay between the signal and the alert. You are not getting a daily newsletter or a market opinion; you are getting the same machine-generated entries and exits that move the book above. See pricing and access.
The record: what 15 years of one NQ book looks like
Run on the NQ mini, 1 to 3 contracts scaled by volatility, since 2011, the book grew $100,000 to $1,212,232, a +1,112.2% gain ($1,112,232 net P&L). It wins less than half the time, a 45.5% win rate, and still grows, because the average winner is 1.86x the average loser. It was positive in 13 of 16 calendar years; the three down years were small (2011 lost $4,889, 2012 lost $240, 2013 lost $2,899).
| Metric | Value |
|---|---|
| Net P&L (NQ mini, 1-3 contracts) | $1,112,232 |
| Trades | 3,500 |
| Win rate | 45.5% |
| Profit factor | 1.55 |
| Avg win / avg loss | 1.86 |
| Expectancy per trade | $318 |
| CAGR | 18.1% |
| Positive years | 13 of 16 (worst -$4,889) |
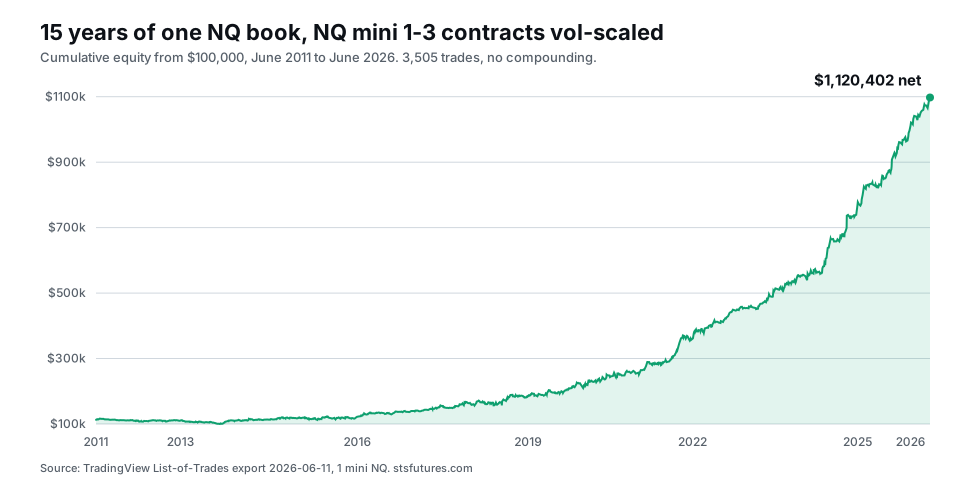
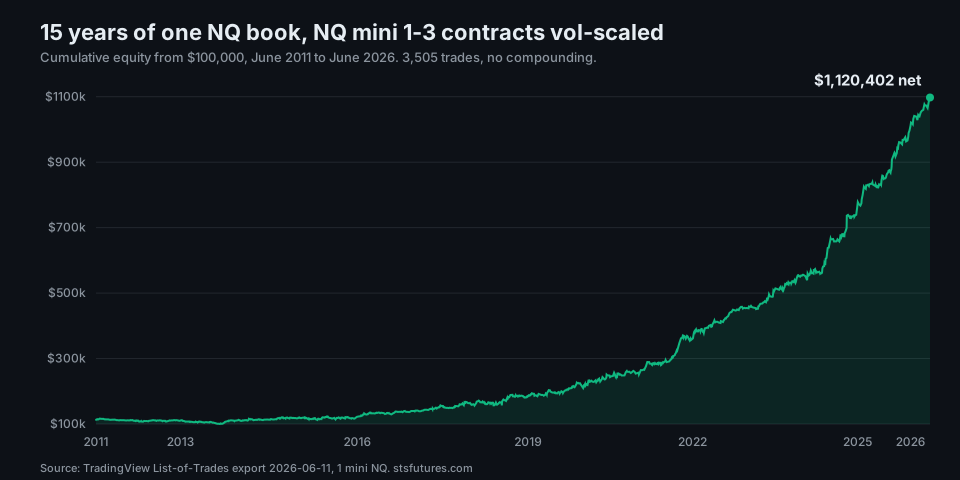
A rising 15-year equity curve is the first thing any signal seller should be able to show. Most cannot, because they have months, not years, and they show winning screenshots instead of the whole curve.
The part almost no one can show: is it luck or a real edge?
A long winning record can still be luck or curve-fitting. The difference is testable, and this is where most "signal" claims fall apart. Our book clears every standard test built to expose a fake edge:
| Test | Result | What it means |
|---|---|---|
| t-stat (Harvey-Liu hurdle 3.0) | Clears 3.0 | The edge is very unlikely to be luck |
| Deflated Sharpe | Passes >90% | Still real after adjusting for the 3,000 variations we tried |
| Per-era profit factor | 1.01 to 1.86, rising | Positive in every 4-year window, and strengthening over time |
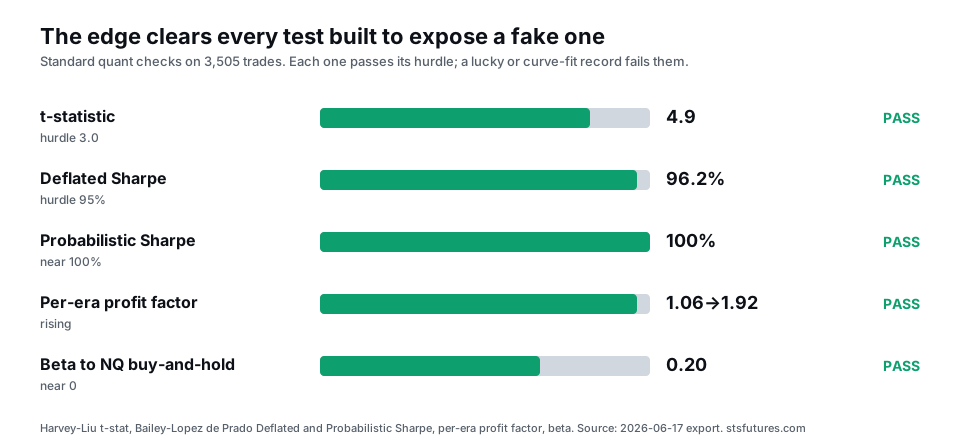
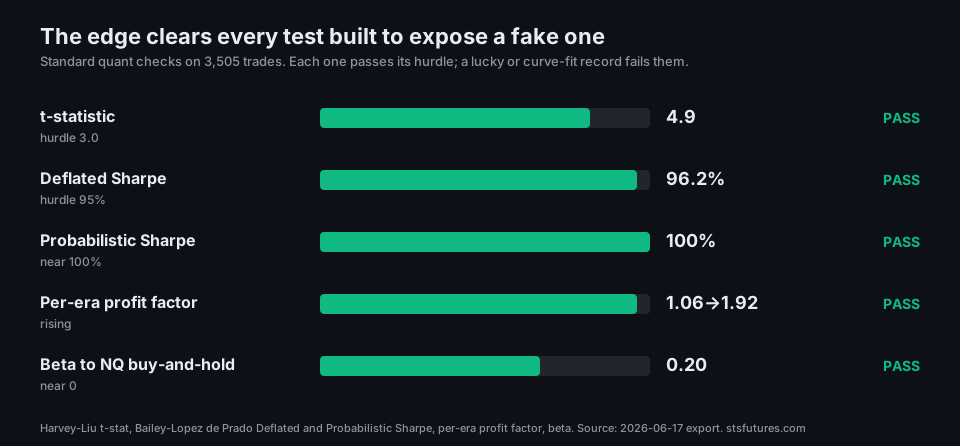
A signal seller who cannot produce a t-stat, a deflated Sharpe, or a walk-forward result is asking you to trust a story. These are the numbers that separate an edge from a lucky streak. For a deeper look at what overfit looks like and why this record passes, see Is my backtest overfit?.
What it does not promise: the real drawdown
A record you can trust is one that shows its worst days, not just its best. The deepest the backtest fell in dollars was $51,836 on the mini book, 4.3% of the peak it fell from; the deepest in percentage terms was a separate, earlier 20.4%, with a worst run of 14 losing trades in a row. And that is one path, not a ceiling: reshuffle the same 3,500 trades and our realised dip sits at the 72nd percentile, deeper than the typical ordering, while one ordering in twenty runs past $67,838. Anyone selling signals without a clear, honest drawdown number is selling the best case as if it were the only case.
Real record vs fake record: how to tell them apart
Use this the next time any service shows you "proof." A real signal track record looks like the left column. Cherry-picked marketing looks like the right.
| A record you can trust | A record you cannot |
|---|---|
| Years of history, the full equity curve | Weeks or months, a few winning trades |
| Every trade public and timestamped | Screenshots of selected wins |
| Statistical tests (t-stat, deflated Sharpe) | "Up 300%" with no method |
| A stated, honest maximum drawdown | No drawdown, or a suspiciously small one |
| One instrument, one clear method | Vague claims across many markets |
| Discloses it sells the signals | Hides the conflict of interest |
Demand four things from any signal seller: the full equity curve, every timestamped trade, the statistical edge tests, and an honest maximum drawdown. We show all four on this page. Most providers cannot show one.
How we measured this
Every figure comes from TradingView strategy backtests on NQ (CME Nasdaq 100 futures), 2011 to 2026 (data as of August 5, 2026), run at 1 to 3 contracts scaled by volatility on $100,000, no compounding. The combined book holds one position at a time and nets to 3,500 trades. Drawdown is the percent of peak equity at the time, TradingView's method. The statistical tests use our per-trade returns against the standard Harvey-Liu and Bailey-Lopez de Prado methods. These are hypothetical results, not live fills; live trading adds slippage and missed fills, and the discipline to sit through a 45.5% win rate. The same numbers reconcile to the public tear sheet, trade for trade.
Who should use these, and who should not
Each alert is clear enough to act on without a trading background: it gives the entry, the direction, and the exit. But the harder part is not reading the signal, it is living with it. NQ futures carry significant risk and are not suitable for everyone, and following a system that wins 45.5% of the time means sitting through long losing streaks (up to 14 in a row in the record above) without abandoning it. The edge is real over 3,500 trades; it is invisible over any ten. If you understand futures mechanics and can hold a rules-based plan through a drawdown, the signals do the analysis for you. The execution never is, and we draw that line exactly in how invite-only TradingView scripts work, and whether they can auto trade NQ. If you would override them on the third loss, no signal service will help.
So, do NQ trading signals work?
A real one can, and it is rare. The test is not the marketing; it is the record. Ask any service for the full curve, every trade, the statistical tests, and the honest drawdown. If they cannot produce all four, you are looking at a story, not an edge. Our NQ signals are the same book shown above, posted in real time, with the full breakdown on our five strategies and every trade on the backtested tear sheet.
See the signals in real time: pricing and access. Full Access is $50/month or $500/year (2 months free): the alerts, the dashboard, the invite-only TradingView script and the complete backtested trade list. Cancel anytime.
All performance data shown is from TradingView backtests and represents hypothetical results. Disclosure: we trade this system live and sell access to the signals; judge the data accordingly. Trading futures involves substantial risk of loss and is not suitable for all investors. This is educational information, not investment advice.