NQ Stop Loss: How Many Points? We Measured 3,139 Trades
Stop asking in points. We tested fixed point stops on all 3,139 trades in our 15-year NQ book. Every width lost money against the baseline. The popular 15 to 40 point widths were a disaster: they kept only 48.6% to 59.6% of the profit. Then we ran the same test with stops set as a percentage of price. Opposite story. A 0.5% stop kept 91.9%. A 1% stop kept almost 100%. A wide ~2% stop slightly beat no stop at all, because it cut off two big losers.
The one rule to leave with: size your stop from price or volatility, never in fixed points. Once the stop is set, the futures position size calculator turns it into a contract count for your account. And keep it wider than the heat your winners normally take. In our data that means beyond about 0.34% of price, the heat 90% of our winners stayed inside.
The rest of this article is the evidence. The reason fixed points fail is hiding in plain sight: NQ traded at 2,354.75 at our first entry in 2011 and 27,084 at our last exit in 2026. A 25-point stop was 1.06% of price then. Today it is 0.092%. Same number, about 11.5 times tighter.
Whose trades are these (read this before using our numbers)
Everything below is measured on our own book: four systematic NQ strategies run as one single-position portfolio. TradingView backtests, 2011 to 2026 (data as of November 6, 2026), 1 or 2 NQ minis a trade (2 when daily ranges are small, 1 when they are large; at today's index level every trade since July 2024 has been 1 contract), commissions and slippage included, $696,892 net. The entries are momentum and trend continuation, intraday plus one overnight model. That style shapes every finding here. Momentum winners move fast and take little heat. A mean-reversion system enters against the move, so its numbers look roughly opposite. A scalper's numbers live on another planet. Our exact figures describe our system only. The method transfers to any trader, including a discretionary one: measure your own trades' worst dips before choosing a stop. The numbers themselves do not transfer.
How far do winning NQ trades go against you?
Not far. The median winner's worst moment was 7.6 points, about $152 per contract, while the median loser bled 21.1 points.
MAE (adverse excursion) is the worst a trade looked before it closed, whether or not it recovered. MFE (favorable excursion) is the best it ever looked. TradingView records both numbers for every trade, so our 3,139-trade record tells us exactly how much pain good trades go through. Figures are NQ price points per contract.
| Percentile | Winners' worst heat (MAE) | Losers' worst heat (MAE) | Winners' best point (MFE) | Losers' best point (MFE) |
|---|---|---|---|---|
| 25th | 2.9 pts | 11.1 pts | 18.9 pts | 3.4 pts |
| Median | 7.6 pts | 21.1 pts | 41.9 pts | 9.9 pts |
| 75th | 21.1 pts | 53.4 pts | 114.9 pts | 24.9 pts |
| 90th | 46.9 pts | 92.4 pts | 198.6 pts | 58.1 pts |
| 95th | 65.4 pts | 117.6 pts | 271.4 pts | 87.9 pts |


The median winner's worst moment was 7.6 points, about $152 per contract. A quarter of winners never went more than 2.9 points against the entry. A momentum trade either works early or it becomes a loser. That gap, winners at 7.6 points of heat versus losers at 21.1, is what a stop is supposed to exploit.
Now the exit side of the map. Nearly half of our losing trades were up at least 10 points before they died. About a quarter were up 25 or more. Most losers are trades that worked and then gave it back. That is an exit problem, not an entry problem. Measure it on your own trades before you touch your stop.
Does a fixed point stop loss work on NQ?
Not in our backtest. Across ten widths on 3,139 trades, no fixed stop beat no stop at all. A 20-point stop kept 51.7% of profit and a 100-point stop kept 94.5%.
The experiment: take all 3,139 trades and add an imaginary stop X points behind every entry. Any trade whose worst dip reached X is counted as stopped at exactly that loss, at its actual size. Every other trade keeps its real result. Ten widths, every trade, no exceptions.
| Fixed stop | Profit kept | Winners killed | Trades stopped |
|---|---|---|---|
| 10 pts | 44.5% | 42.0% | 1,940 |
| 15 pts | 48.6% | 32.0% | 1,567 |
| 20 pts | 51.7% | 25.7% | 1,274 |
| 25 pts | 54.0% | 21.5% | 1,093 |
| 30 pts | 53.8% | 18.0% | 956 |
| 40 pts | 59.6% | 12.3% | 744 |
| 50 pts | 66.1% | 8.9% | 600 |
| 75 pts | 83.9% | 3.7% | 297 |
| 100 pts | 94.5% | 1.3% | 161 |
| 150 pts | 94.9% | 0.4% | 48 |
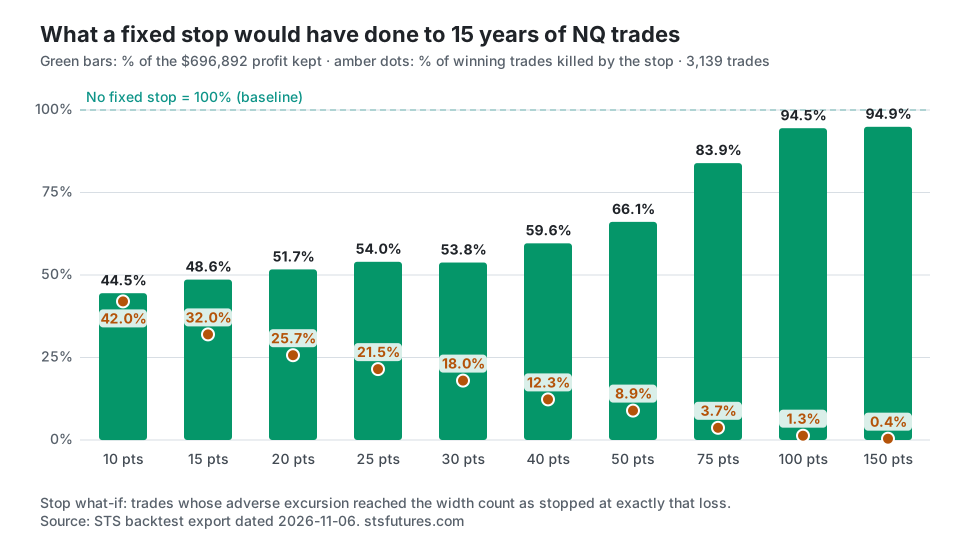
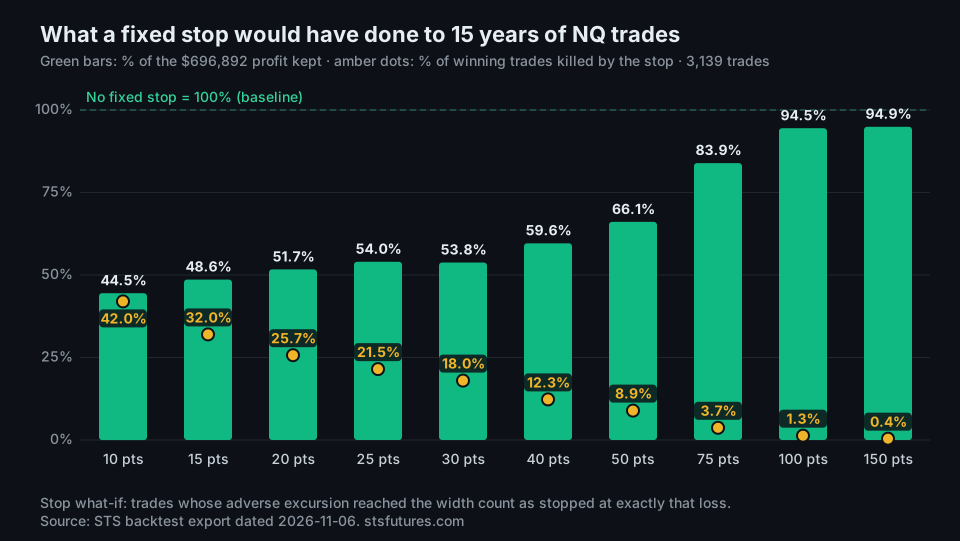
Why is a points-based stop this bad? Because a fixed width is a moving target in disguise. A 20-point stop was a sane 0.85% of price in 2011. By 2026 it had silently become a 0.074% noise-trigger. Any fixed-unit rule decays as the price level changes. That is also why point stops tuned in a backtest rot live. It matches what we see when we test execution changes in the actual engine: we have run stop and exit variants in TradingView many times, and none beat our production exit logic.
Should an NQ stop loss be in points or percent?
In percent of price or ATR, never points. In our backtest a 1.5% stop kept 100.6% of profit, just past the no-stop baseline.
Now run the identical what-if with the stop set as a percentage of position value instead. That is the simplest form of "adapts to price":
| Fixed stop (% of price) | Profit kept | Winners killed | Trades stopped |
|---|---|---|---|
| 0.10% | 35.1% | 55.6% | 2,443 |
| 0.25% | 65.1% | 20.4% | 1,476 |
| 0.50% | 91.9% | 3.7% | 479 |
| 0.75% | 92.4% | 0.8% | 109 |
| 1.00% | 99.8% | 0.3% | 38 |
| 1.50% | 100.6% | 0.0% | 6 |
| 2.00% | 100.4% | 0.0% | 2 |
| 3.00% | 100.1% | 0.0% | 1 |
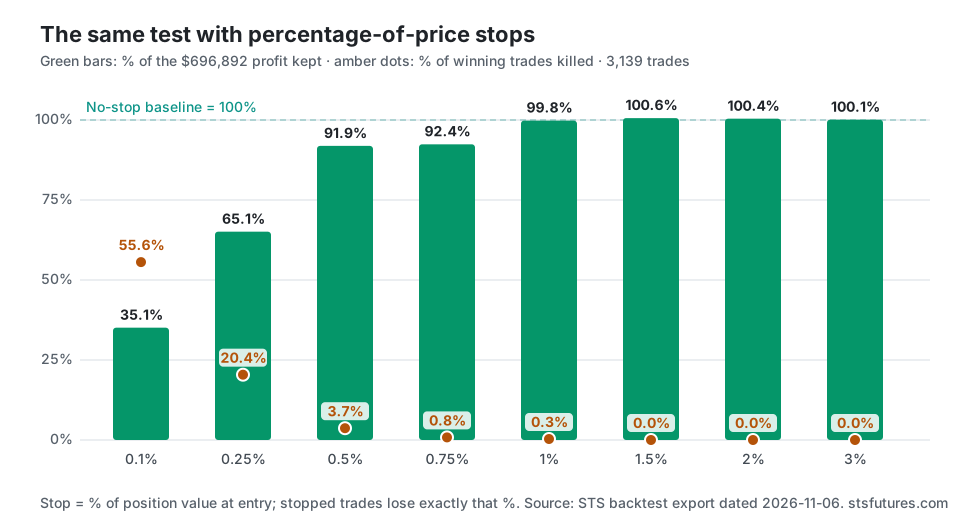
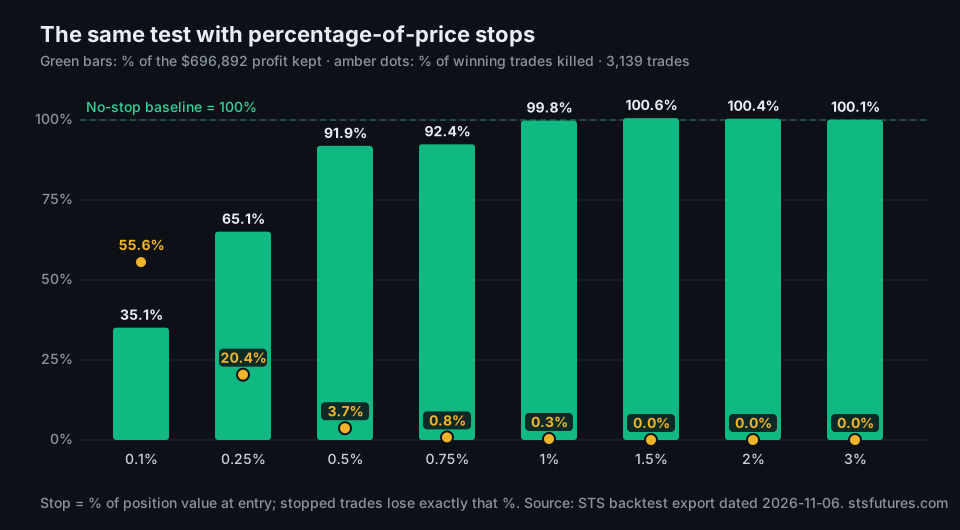
A fixed point stop is a moving target in disguise: 25 points was 1.06% of NQ's price in 2011 and 0.092% in 2026. Express stop width in percent of price or ATR, never in points, and keep it wider than your winners' typical heat.
Same trades, same rules, completely different curve. Once the width adapts to price, the damage collapses. Half a percent of price (roughly 12 points in 2011, 135 today) already keeps 91.9% of the profit. By 2% the stop touched only two trades, both big losers, and finished slightly ABOVE the baseline.
We read that 100.4% as noise, not edge. But the lopsidedness is the point: a wide percentage stop cost basically nothing and put a ceiling on the kind of single-trade disaster that ends accounts. Our worst single loss was $7,814. Tight stops of either kind still kill winners. In our momentum book the winners' median heat sits near 0.11% of price. So any stop tighter than about 0.34% (the winners' 90th percentile in percent terms) fires in the zone where good trades still live.
One honest step further: percentage-of-price is the simplest adaptive stop, not the best one. Volatility is not constant either, as NQ and ES average daily range shows year by year. That is why serious systems scale stops by ATR, or place them behind real structure, the level where the trade idea is dead. It is also why our own book bounds risk with sizing that steps down to one contract when daily ranges are large, time-based exits, and account-level kill-switch rules. We did not simulate ATR stops here because excursion data cannot reproduce them faithfully. That test belongs in the engine, and it is on our research list.
What a discretionary trader can take from this
Not our numbers, our procedure. Export your last few hundred trades. Any TradingView strategy export, and most broker reports, carry the excursion columns or enough data to derive them.
Then compute three things. One: your winners' median and 90th-percentile MAE. That tells you where your stop stops killing winners. Two: your losers' median MFE. That tells you whether your real leak is the exit. Three: the what-if tables above, on your own fills. That tells you what any fixed rule would actually have cost you, in your style. If you trade mean reversion, your winners are the trades that survive early heat, so your map will look nothing like ours.
Then make the stop adaptive: a percentage of price or a multiple of current ATR, never the same point number in every regime. And if the dollar risk is too big for the account, trade the smaller contract, not the tighter stop. 0.5% of price on NQ is about $2,708 per mini today but $271 on MNQ. The sizing math is in NQ vs ES futures. Width protects the trade. Size protects the account.
If you trade a funded prop account, sizing against the account rules is the whole game. We ran that math in what an account of a given size can actually hold.
How we measured this
Instrument: CME Nasdaq-100 E-mini (NQ), $100,000 initial capital, no compounding. Position size is 1 or 2 NQ minis a trade (854 trades at one contract, 2,285 at two): 2 when daily ranges are small, 1 when they are large; at today's index level every trade since July 2024 has been 1 contract. So point figures are normalized per contract (excursion dollars divided by $20 times contracts). Percentage figures use TradingView's excursion-percent basis, relative to position value at entry. Data: our backtested 4-strategy book on TradingView, 2011-11-16 through 2026-11-06, 3,139 trades (1,423 winners, 1,716 losers), commissions and slippage included.
This is an excursion-based what-if, not an engine backtest, and it has three honest limits. First, TradingView measures excursions from bar extremes, so within-bar sequencing is approximate. A real stop could fire on a wick this method never sees. Second, fills are assumed at exactly the stop price, which flatters the stop. Real NQ stops slip, and gaps blow through them. Third, position size is held constant. A tighter stop would let a trader size up and recover some of the gap, though in our in-engine testing nowhere near all of it. These are hypothetical backtest results, not live fills. Our trade-level history, with entry times and prices, is proprietary, so we do not publish it; the result of every trade is in our downloadable trade list. The method reproduces on any TradingView trade list, and our published numbers reconcile to the full tear sheet.
Our subscribers trade these entries as real-time signals from the same book measured above, exits and risk structure included. The complete statistics, drawdowns and all, are on the strategy page. Plans are on the pricing page.
We trade this book live and sell access to the signals, so judge the data accordingly. This article is educational and is not investment advice. Futures trading involves substantial risk of loss and is not suitable for every investor.
Hypothetical performance disclaimer (CFTC Rule 4.41): hypothetical or simulated performance results have certain limitations. Unlike an actual performance record, simulated results do not represent actual trading. Also, since the trades have not been executed, the results may have under- or over-compensated for the impact, if any, of certain market factors, such as lack of liquidity. Simulated trading programs in general are also subject to the fact that they are designed with the benefit of hindsight. No representation is being made that any account will or is likely to achieve profit or losses similar to those shown. Past performance does not indicate future results.
See what STS NQ futures signals are and how they reach you and our forward record, every live signal we have sent, dated and public.