Can I download all 3,500 trades in the STS NQ backtest and check them myself?
Short answer. Yes. We publish every trade so you can check us: one CSV file lists all 3,500 trades in the STS hypothetical NQ backtest, August 2011 to August 2026, and a few spreadsheet formulas or a short Python script rebuild its published figures, from the $1,112,232 net and the 45.5% win rate to the largest dollar drawdown, $51,836.
This page gives you the file and two ways to check it: a spreadsheet route with no coding, and a Python route. Checking matters because a backtest you cannot rebuild is only a claim. The same file also shows what a headline figure hides: our largest drawdown in dollars is the most recent one, and most of the profit came from 2021 on. Every number here is from a hypothetical backtest. What the live signals did is on our forward record.
Download sts-trade-list-2011-2026-08-05.csv (3,500 rows, about 115 KB). Licence: CC BY 4.0: free to use and share, with credit to STS Futures (stsfutures.com).
What is in the file?
One row per trade, 3,500 rows in time order, five columns. A trade is one entry and its exit, also called a round trip. Every row is hypothetical: a backtest of how our five-strategy book would have traded NQ futures (the E-mini Nasdaq-100), one position at a time, at one to three contracts sized by recent volatility.
| Column | Name | What it means |
|---|---|---|
| A | trade_number |
The trade's place in time order, 1 to 3,500 |
| B | exit_month |
The month the trade closed, written YYYY-MM, New York time |
| C | after_go_live |
1 if the trade was entered on or after July 6, 2026, the day our signals went live; 0 if before |
| D | net_pnl_usd |
What the trade made or lost in US dollars, after commission, at one to three NQ mini contracts |
| E | cumulative_pnl_usd |
The running total: column D added up from trade 1 to this row |
How do I check the STS numbers myself?
Count the rows and add up column D for the trade count and the net; track how far the running total falls below its best level so far for the largest dollar drawdown. Both routes below, a spreadsheet with no coding or a short Python script, give the same answers.
Two terms first. The win rate is the share of trades that made money. No trade in the file nets exactly zero, so the other 1,909 trades are all losses. A drawdown is the drop from a previous high in the running total. We measure it each time a trade closes, which is called closed-trade drawdown.
Route 1: Google Sheets or Excel
- Click the download link above and save the file.
- Open the file.
- In Google Sheets:
- Go to sheets.google.com and click Blank spreadsheet.
- Choose File > Import, then click the Upload tab.
- Select the file, set Import location to Replace current sheet, and click Import data.
- In Excel: choose File > Open > Browse, select the file and click Open. If it is not listed, set the file type to All Files.
- In Google Sheets:
- Check the layout. Row 1 holds the column names and rows 2 to 3501 hold the 3,500 trades. Column D is
net_pnl_usdand column E iscumulative_pnl_usd. Your spreadsheet may showexit_monthas a date; that does not affect any formula here. - Click cell F2, type
=MAX(0,E2)and press Enter. Column F will hold the running peak: the best running total so far, starting from $0. - Click cell F3, type
=MAX(F2,E3)and press Enter. - Click F3 and press Ctrl+C (Cmd+C on a Mac) to copy it.
- Click the Name Box, the small box left of the formula bar that shows F3, type
F3:F3501and press Enter. This selects the column down to the last trade. - Press Ctrl+V (Cmd+V) to paste. Every cell down to F3501 now holds the running peak.
- Click cell G2, type
=F2-E2and press Enter. Column G will hold the drawdown after each trade. - Copy G2 down to row 3501 the same way as steps 6 to 8, typing
G2:G3501in the Name Box. - Type each formula below into its own empty cell, for example J2, J3 and so on, and compare the result with the last two columns.
| Check | Type this | You should see | Our published figure (hypothetical) |
|---|---|---|---|
| Trades | =COUNT(D2:D3501) |
3500 | 3,500 |
| Net P&L | =SUM(D2:D3501) |
1112232.4 | $1,112,232 |
| Win rate | =COUNTIF(D2:D3501,">0")/COUNT(D2:D3501) |
about 0.4546 | 45.5% |
| Largest dollar drawdown | =MAX(G2:G3501) |
51836.2 | $51,836 |
| The same drawdown as a share of the $100,000 account | =MAX(G2:G3501)/100000 |
about 0.5184 | 51.8% |
- To see a result as a percentage, click its cell and choose Format > Number > Percent in Google Sheets, or click the % button on Excel's Home tab.
- Optional, for the drawdown section below: type
=SUMIF(C2:C3501,0,D2:D3501)-MINIFS(E2:E3501,C2:C3501,1)in an empty cell. You should see 41109.7, the fall from $1,106,089.50, the last total before go-live, to the low of $1,064,979.80. MINIFS needs Google Sheets or Excel 2019 or later. - Optional: click H2, type
=G2/(100000+F2), copy it down to H3501 as in steps 6 to 8, then type=MAX(H2:H3501)in an empty cell. You should see about 0.2043 (20.4%), the deepest drawdown as a share of the account's value at the time.
Route 2: Python
- Go to python.org/downloads and click the yellow Download Python button.
- Run the installer. On Windows, tick "Add python.exe to PATH" on the first screen, then click Install Now.
- Open a terminal, the window where you type commands. On Windows, press the Windows key, type
cmdand press Enter. On a Mac, press Cmd+Space, typeTerminaland press Enter. - Check that Python works: type
python --version(on a Mac,python3 --version) and press Enter. You should seePython 3followed by a version number. - Install pandas, a free library that reads tables: type
pip install pandas(on a Mac,pip3 install pandas) and press Enter. The last line should start withSuccessfully installed, orRequirement already satisfiedif you already have it. - Make a new folder and move the downloaded CSV into it.
- Open a plain text editor: Notepad on Windows, or TextEdit on a Mac followed by Format > Make Plain Text.
- Paste the script below into the editor.
- Save it in the folder from step 6 as
check_sts.py. In Notepad, set Save as type to All files so the name does not end in .txt. - In the terminal, type
cdand a space, drag the folder into the terminal window, and press Enter. - Type
python check_sts.py(on a Mac,python3 check_sts.py) and press Enter.
The script reads the file, rebuilds the running total and its drawdowns, and prints seven checks. Every line has a comment above it saying what it does.
# Load pandas, the library that reads and adds up tables.
import pandas as pd

# Read the trade list: one row per trade, 3,500 rows.
df = pd.read_csv("sts-trade-list-2011-2026-08-05.csv")

# Take each trade's result in US dollars.
pnl = df["net_pnl_usd"]

# Add the results up in order: the running total after each trade.
total = pnl.cumsum()

# The running peak: the best running total so far, starting from $0.
peak = total.cummax().clip(lower=0)

# The drawdown after each trade: how far the running total sits below its peak.
drawdown = peak - total

# Count the trades.
print("Trades:", len(df))

# Add up every result.
print("Net P&L in dollars:", round(pnl.sum(), 2))

# The share of trades that made money, as a percentage.
print("Win rate %:", round(100 * (pnl > 0).mean(), 1))

# The largest dollar drawdown.
print("Largest dollar drawdown:", round(drawdown.max(), 2))

# The same drawdown as a share of the $100,000 account.
print("Largest dollar drawdown % of $100,000:", round(100 * drawdown.max() / 100000, 1))

# The deepest drawdown as a share of the account's value at the time ($100,000 plus the peak).
print("Deepest drawdown % of equity:", round(100 * (drawdown / (100000 + peak)).max(), 1))

# The part of the largest dollar drawdown from trades entered on or after go-live (after_go_live = 1):
# the last total before go-live minus the lowest total after it.
live = df["after_go_live"] == 1
print("Drawdown after go-live in dollars:", round(pnl[~live].sum() - total[live].min(), 2))
You should see exactly this (hypothetical backtest figures):
Trades: 3500
Net P&L in dollars: 1112232.4
Win rate %: 45.5
Largest dollar drawdown: 51836.2
Largest dollar drawdown % of $100,000: 51.8
Deepest drawdown % of equity: 20.4
Drawdown after go-live in dollars: 41109.7
If either route gives different numbers, your copy of the file is incomplete or the file has changed.
What does the largest dollar drawdown in the file look like?
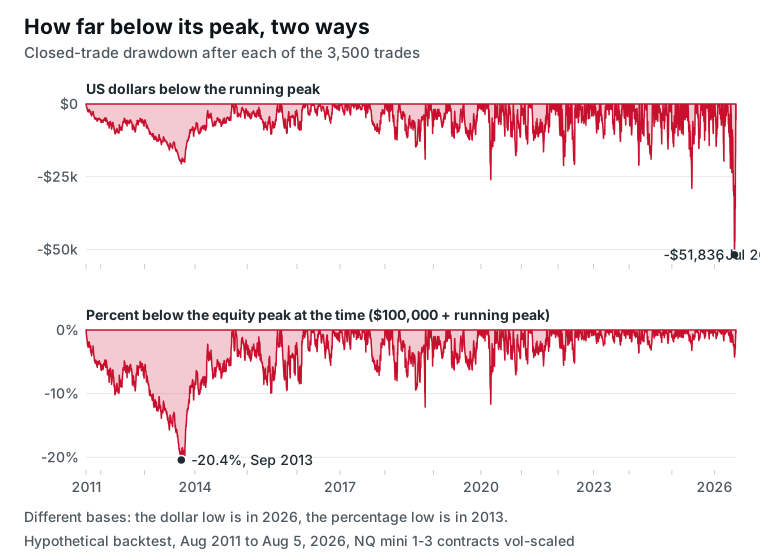
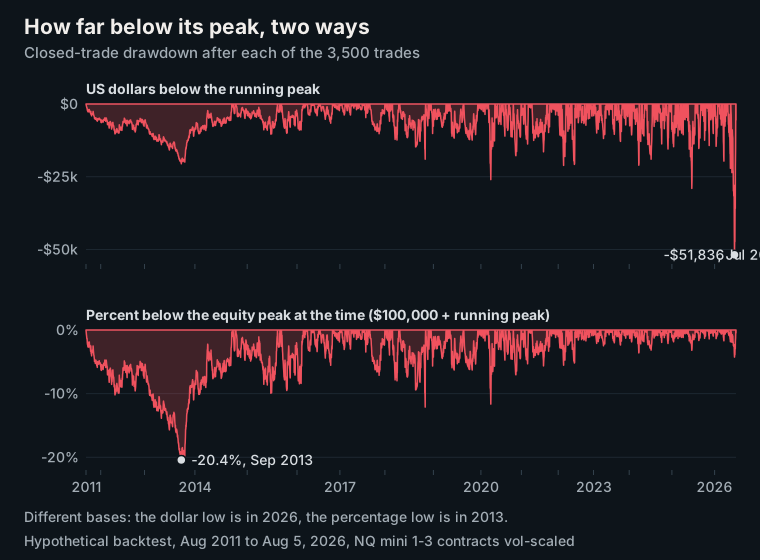
The largest dollar drawdown is the most recent one, and most of it came after our signals went live. The running total peaked at trade 3,472, closed June 15, 2026, and fell $51,836 to its low at trade 3,492, closed July 20, 2026. Of that $51,836, $41,110 (79%) came from backtest trades entered on or after July 6, 2026, the day the signals went live.
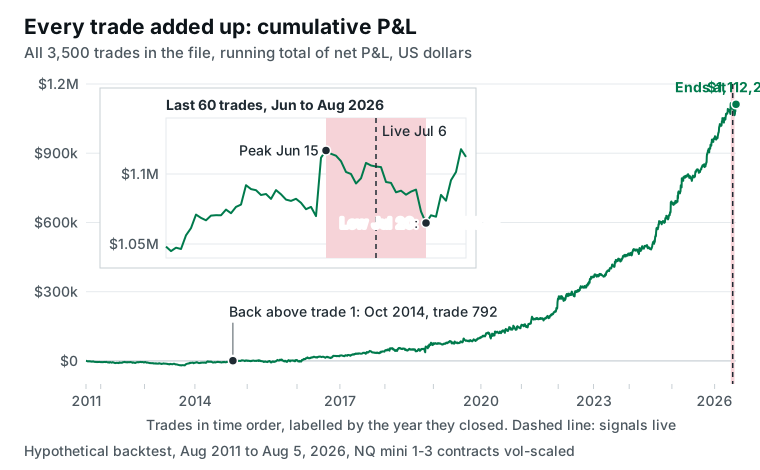
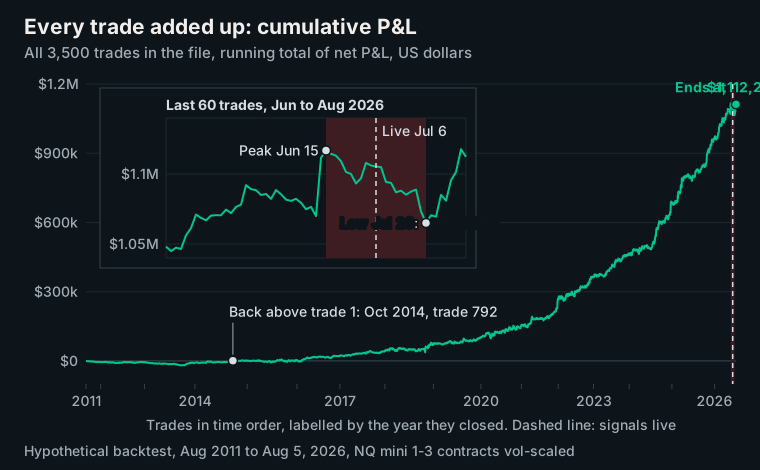
The backtest closed at a new high on August 4, 2026, at trade 3,499, and the file ends $5,508 below it.
How large that drop looks depends on what you divide it by. It is 51.8% of the fixed $100,000 account our returns are quoted on, and 4.3% of the $1,216,816 equity peak it fell from. On micro contracts at the same one to three count (MNQ, one tenth the size, so every dollar times 0.1) it is $5,184. What that means for account size is in who STS is not for.
The deepest drawdown as a share of the account's value at the time is a different, older episode: 20.4%, $20,573 below a $100,721 peak. That peak was the very first trade, on August 11, 2011, and the low came in September 2013. It took just over three years, and 791 more trades, to close above that first trade's total, at trade 792 in October 2014.
Did the backtest make money in every period?
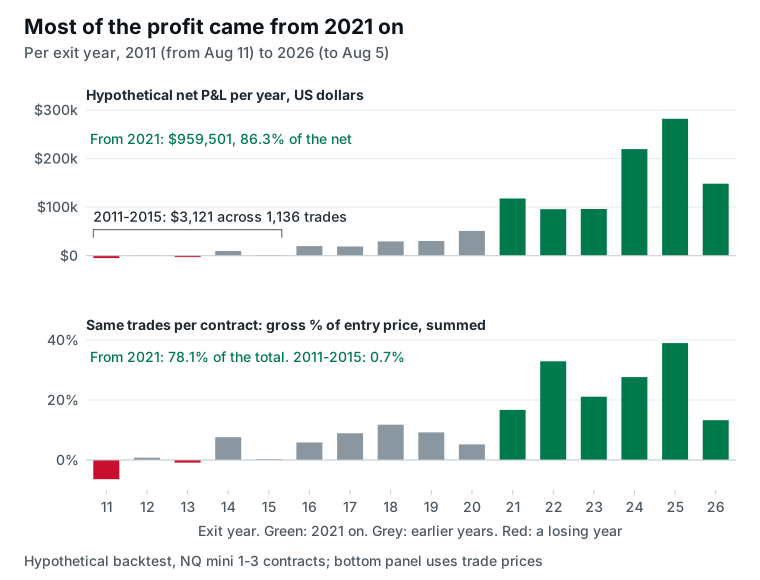
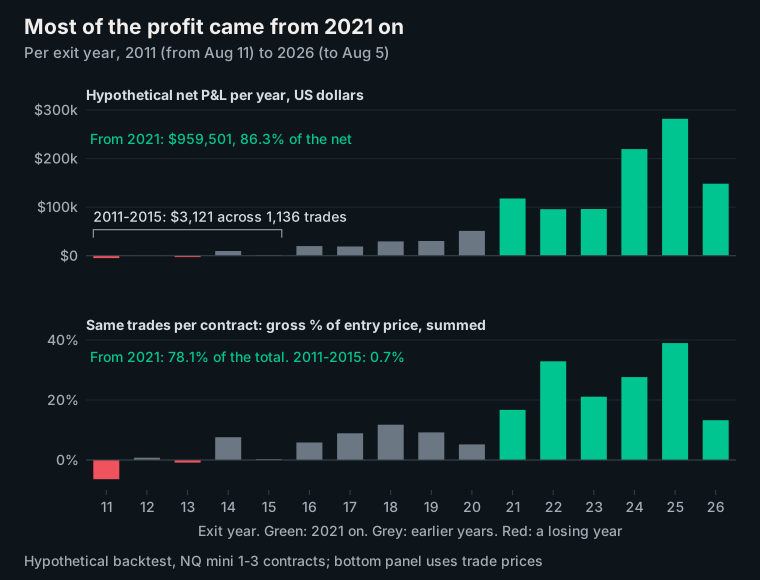
No. Trades closed from 2011 to 2015 were close to flat, and about a third of all months lost money. Those 2011 to 2015 trades netted $3,121 across 1,136 trades. Trades closed from 2021 on produced $959,501, or 86.3% of the $1,112,232.
Part of that gap is the index level. Every NQ point is worth $20, and NQ moves more points at 20,000 than at 2,000. Measured per contract as a percentage of price, which removes that effect, 2021 onward still holds 78.1% of the total and 2011 to 2015 holds 0.7%. How the book did in each NQ decline covers the same years.
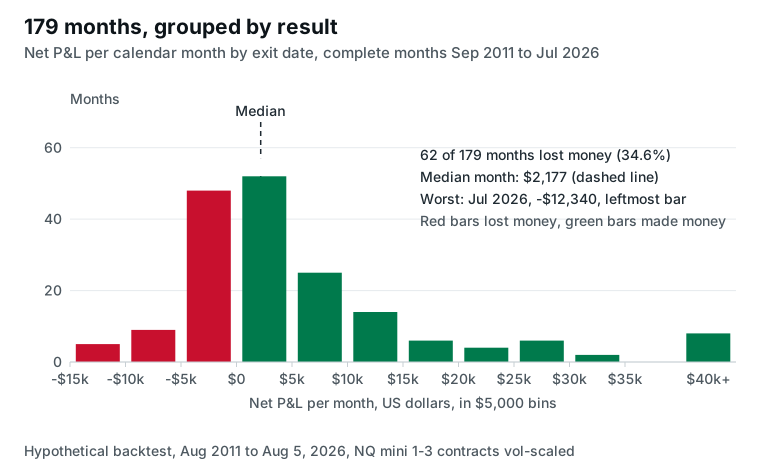
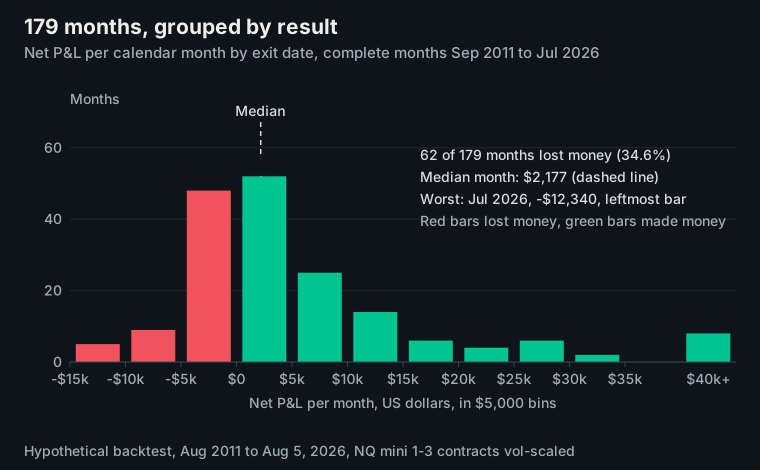
Losing months are routine. Of the 179 complete calendar months from September 2011 to July 2026, 62 (34.6%) lost money in book dollars. The median month, the one in the middle when all 179 are sorted by result, made $2,177. The worst was July 2026 at -$12,340, which includes one trade entered on July 2, before go-live.
How much of the result depends on a few large trades?
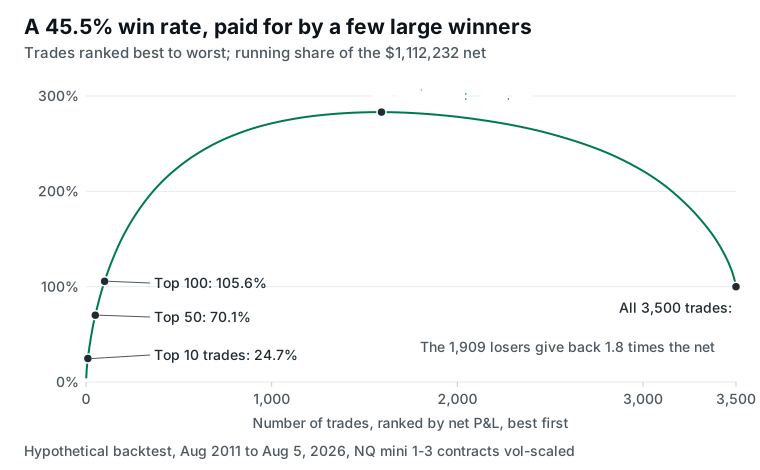
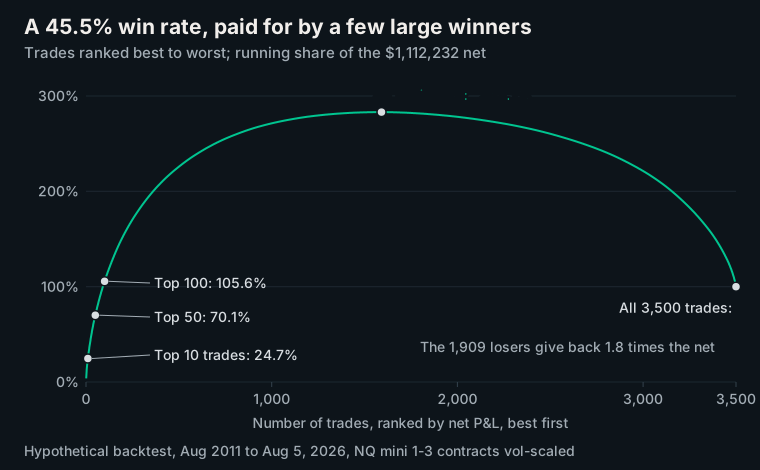
Most of it. The best 100 trades earned 105.6% of the $1,112,232 net, more than the whole profit; the best 10 earned 24.7% and the best 50 earned 70.1%. The backtest won 1,591 of 3,500 trades (45.5%), so it lost more often than it won and was paid by the size of its winners. The 1,591 winners earned 2.8 times the net, and the 1,909 losers gave back 1.8 times it. The long runs of small losses between those winners are in our worst losing streak.
What costs are already in the numbers?
Commission is in every row and slippage is charged on market and stop orders; exchange data fees, platform fees and taxes are not included. Commission is $4.10 per contract per round trip, $2.05 on each side.
Slippage means filling at a worse price than the order asked for. The backtest charges two ticks on every market and stop order, where a tick is the smallest price step, 0.25 points or $5 per contract, so $10 per contract per fill. That covers 864 of the 3,500 entries and 3,439 of the 3,500 exits. The other 2,636 entries and 61 exits are limit orders, which fill only at a set price; the backtest fills them at the bar's closing price with no slippage.
We checked that model against another vendor's independent NQ price series, which runs to May 2025. 779 of 802 market entries sit exactly two ticks worse than the independent price at that moment, which is the slippage the backtest charges. 2,268 of 2,426 limit entries match it exactly.
Costs do not decide the full-file result. If every unslipped fill had also paid $10 per contract, those 4,533 contract-fills (one contract bought or sold once) would have cost a further $45,330, or 4.1% of the $1,112,232 hypothetical net. Across all 12,672 contract-fills the net is $87.77 per fill, or 17.6 ticks. The 2011 to 2015 trades are different: their $3,121 across 4,214 contract-fills is $0.74 per fill, under a fifth of a tick, so a small extra cost would have erased that period.
What can't the file tell you?
It cannot show live results, and it cannot be checked against market prices. It is a backtest, not an account statement.
Nineteen of the 3,500 trades were entered on or after July 6, 2026; they are the backtest results of the signals we sent from July 6 to August 5. At book size (1 to 3 contracts) and before commission, the 16 entered in July lost $10,425 ($10,645 per NQ contract) and the three entered from August 1 to 5 made $16,695, together $6,270, the backtest figure our forward record shows beside the live results. Our first 30 days of signals compares July trade by trade.
The file leaves out entry and exit times, prices, contract counts and which strategy took each trade, because times and prices together would publish when each strategy enters. What it proves is narrower: our published figures are the arithmetic of one fixed list of results. Full Access members also get the complete backtested trade list on the dashboard, filterable by date, direction and P&L. It also leaves out the deepest point each open trade reached, so our published open-trade drawdown of $55,050, which also counts losses on trades still open, cannot be rebuilt here. Methods for testing a backtest harder are in is my backtest overfit.
What does this mean for you?
You do not have to take our backtest figures on trust. A few formulas rebuild the headline figures, including the $51,836 largest dollar drawdown and the 79% of it that came after go-live. If you are weighing the signals, judge them against what the file shows:
- more losing trades than winning ones, 1,909 against 1,591;
- a losing month about one month in three, 62 of 179;
- a result carried by its largest winners, with the best 100 trades earning more than the whole net.
All of that is a hypothetical backtest. For what the signals have done since July 6, 2026, use the forward record.
How we measured this
- Data: our backtest of the five-strategy NQ book, 3,500 round trips, first entry August 11, 2011, last exit August 5, 2026.
- Basis: NQ mini at $20 per point, one to three contracts scaled by volatility, one position at a time, $100,000 nominal account, no compounding.
- Costs: $4.10 per contract round-trip commission in
net_pnl_usd; two ticks of slippage on market and stop fills; none on limit fills. Fill prices checked against an independent price series to May 2025. - Drawdown: closed-trade, from the running peak of cumulative P&L. Percent figures state their denominator.
- Periods: a trade belongs to the month and year in which it closed, New York time.
after_go_liveis set by entry date. - Excluded: times, prices, strategy, contract counts, intrabar excursions and live results.
- Check: the Python script and its output on this page were run on the public CSV itself and match our published statistics. The cost, fill-check and per-contract figures come from the full backtest export, which includes prices.
STS sends NQ futures signals from this five-strategy book by email, the web dashboard and a live feed, at $50 a month or $500 a year.
Hypothetical Performance Disclaimer (CFTC Rule 4.41): These results are based on simulated or hypothetical performance results that have certain inherent limitations. Unlike the results shown in an actual performance record, these results do not represent actual trading. Also, because these trades have not actually been executed, these results may have under- or over-compensated for the impact, if any, of certain market factors, such as lack of liquidity. Simulated or hypothetical trading programs in general are also subject to the fact that they are designed with the benefit of hindsight. No representation is being made that any account will or is likely to achieve profits or losses similar to these being shown.
Past performance is not necessarily indicative of future results. Futures trading involves substantial risk of loss and is not suitable for all investors.
See what STS NQ futures signals are and how they reach you and our forward record, every live signal we have sent, dated and public.