Our backtest's worst losing streak: 14 trades in a row
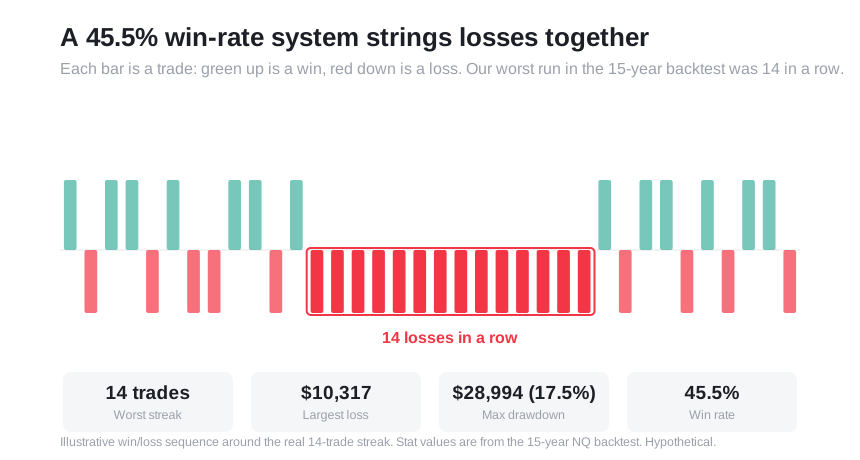
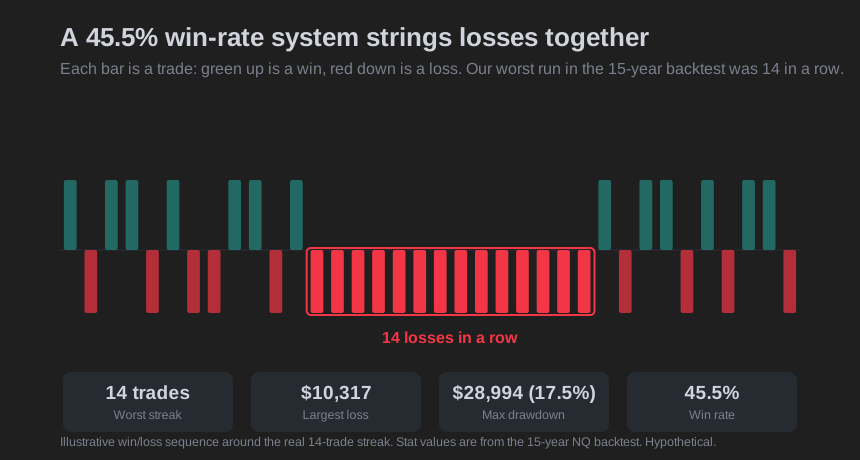
Ask any signal service to show you their worst losing streak. Most will change the subject. We will not, so here is ours: 14 losing trades in a row.
That number is not a confession. It is the point. A system that loses 54.5% of its trades is going to string losses together, and it is going to do it more than once. If a seller cannot tell you their worst streak, they either do not know it or do not want you to.
Whose trades are these
These are the STS Research NQ (E-mini Nasdaq-100 futures) signals, the same five-strategy book we trade live and publish. The record covers August 2011 to August 2026, 3,500 backtested trades on NQ (data as of August 5, 2026). Every figure below comes from that record. When we say "worst," we mean the worst that appears in the hypothetical history, not a rounded or cherry-picked slice.
A winning system that loses most of its trades
The book's headline hypothetical result is net $1,112,232 over 3,500 trades. The win rate is 45.5%, which means it lost 54.5% of the time. Read that twice, because it is the part most people get wrong about systematic trading.
The edge is not how often it wins. The edge is two things working together. First, the payoff ratio is 1.86: the average winning trade was $1,979 while the average losing trade was $1,067. Wins were bigger than losses. Second, the five sub-strategies have low correlation to each other, so a bad run in one does not usually line up with a bad run in the others. Profit factor came out to 1.55 and expectancy to $318 per trade, and the edge clears the 3.0 significance hurdle across 3,500 trades.
When the win rate is below half, losing streaks are not a malfunction. They are arithmetic. Flip a coin weighted to tails 54.5% of the time and you will see long runs of tails. The 14-trade streak is what that looks like in practice.
The ugly numbers, in one place
Here is the full downside of the hypothetical record, stated plainly.
- Worst losing streak: 14 trades in a row.
- Largest single loss: $15,628.
- Average loss: $1,067.
- Largest single win, for contrast: $41,772.
- Max dollar drawdown: $51,836, which is 4.3% of the peak it fell from (our worst in percentage terms was a separate, earlier 20.4% episode). (The TradingView intrabar figure is higher at $55,050, because it counts the deepest point reached inside bars.)
- Worst calendar year: down $4,889 in 2011. 13 of the 16 calendar years were positive.
None of that is comfortable to publish. All of it is real to the record, and all of it is the sort of thing you should see before you pay anyone for signals.
The backtest streak is not the worst you should plan for
This is where honesty gets uncomfortable for us, not just for the industry.
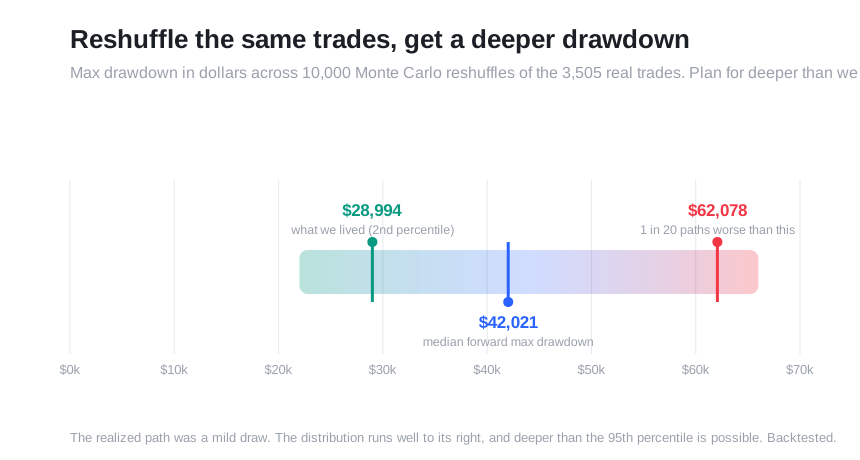
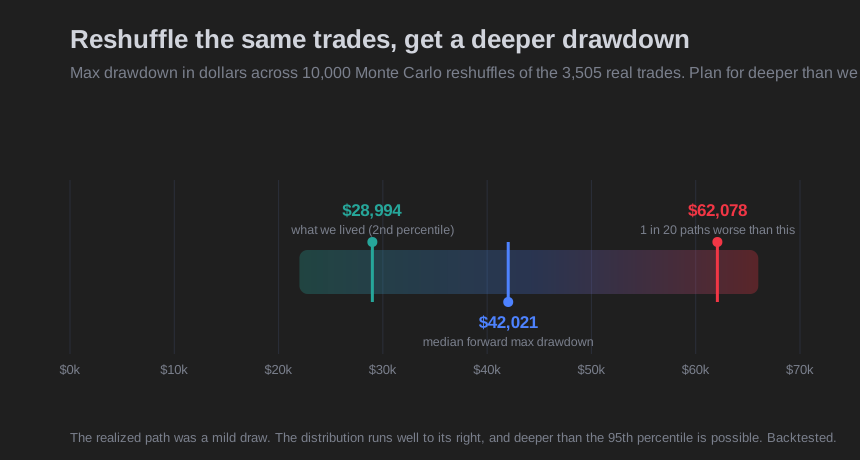
The 14-trade streak and the $51,836 drawdown are what happened in one particular order of trades: the order history handed us. But the order of wins and losses is close to random. Reshuffle the same 3,500 backtested trades into a different sequence and you get a different worst drawdown, sometimes much deeper.
We ran that test. In 10,000 reshuffles of the backtested trades (a Monte Carlo simulation), the backtested $51,836 drawdown sits at the 72nd percentile. In plain terms, the path history dealt us was rougher than the typical one, not calmer. The median maximum drawdown across those reshuffles was $45,379, and 1 in 20 paths exceeded $67,838.
So do not treat $51,836 as the ceiling just because it is worse than average. Deeper paths exist, and a 1-in-20 outcome ran past $67,838. The lesson is simple: plan for a drawdown worse than the one in the track record, because the track record only shows one draw from the deck.
If those dollar figures are larger than your account can absorb, that is useful information, not a reason to look away. The same book on Micro NQ (MNQ) contracts is one tenth the dollars, so the reshuffled drawdowns scale down with it, with the backtested figure near $5,184. Sizing is how you match a system's real range to your account. For more on that, see how long STS drawdowns tend to last and why you should expect a worse drawdown than the backtest, and work through the NQ account-size reality check before funding anything.
What to demand from any signal seller
You do not need to trust us on this. Use the same questions on every service you look at, including this one.
- Show me your worst losing streak, in number of trades. If they cannot say it fast, they do not track their own downside.
- Show me the maximum drawdown in dollars, not just a percentage. Percentages hide the account pain.
- Tell me the win rate, and do not be impressed by a high one on its own. A 90% win rate with tiny wins and rare huge losses is a worse deal than a 45.5% rate with a 1.86 payoff ratio.
- Is the record a live TradingView script and a full trade list, or is it screenshots? Screenshots are marketing. A trade-by-trade record is evidence. We showed the gap in running the strategy on your own chart versus trusting screenshots.
- Ask whether the figures are hypothetical or live, and read the disclaimers.
If you want to run those checks on us, the full record is on the tear sheet, and our track-record audit guide walks through how to pull a seller's numbers apart.
A limitation we will state out loud
The 3,500-trade record is a backtest of the current five-strategy book across historical NQ data. It reflects rules applied to prices that already happened. Live execution adds slippage, fills, and the human factor of actually clicking when the system says to during a 14-trade skid. We put a number on that last part in the cost of skipping trades after a loss. The Monte Carlo work above is our attempt to widen the range you plan for, but it reshuffles past trades and cannot manufacture market conditions that never occurred in the sample.
Conflict disclosure
We trade this book live and we sell access to the signals. Those interests point the same way most of the time and not always, so we publish the losing streak, the worst loss, and the deeper-than-backtested drawdown estimates precisely so the ugly parts are on the table before you decide.
If radical transparency is the standard you want from a signal service, check our numbers against the checklist above, then see the plans on the pricing page. One month of signals is still far too small a sample to judge an edge, so judge it on the full record.
Hypothetical Performance Disclaimer (CFTC Rule 4.41): These results are based on simulated or hypothetical performance results that have certain inherent limitations. Unlike the results shown in an actual performance record, these results do not represent actual trading. Also, because these trades have not actually been executed, these results may have under- or over-compensated for the impact, if any, of certain market factors, such as lack of liquidity. Simulated or hypothetical trading programs in general are also subject to the fact that they are designed with the benefit of hindsight. No representation is being made that any account will or is likely to achieve profits or losses similar to these being shown.
Past performance is not necessarily indicative of future results. Futures trading involves substantial risk of loss and is not suitable for all investors.