How to audit a trading track record: 7 checks
We ran a strict seven-check audit on our own backtested NQ book, 3,500 trades over 15 years, and it passed all seven. But on the check that matters most, the t-stat, only one of our five strategies clears the bar standing alone. We are telling you that up front, because the point of an audit is to find the thin spot, not to print a row of green checkmarks.
Here are the seven checks. Demand a number for each: a big enough sample, a t-stat over 3, a profit factor above 1 in every era, costs actually subtracted, a drawdown percentage you can trace to a denominator, a planning drawdown from a reshuffle, and the losing years shown. Below is the full scorecard, the threshold for each, and the one line where a strict auditor would push back on us.
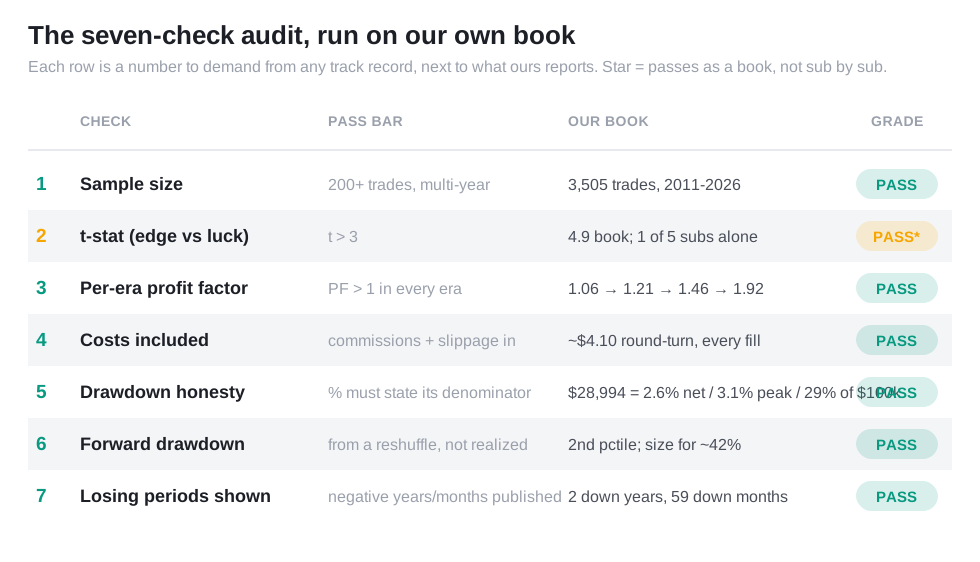
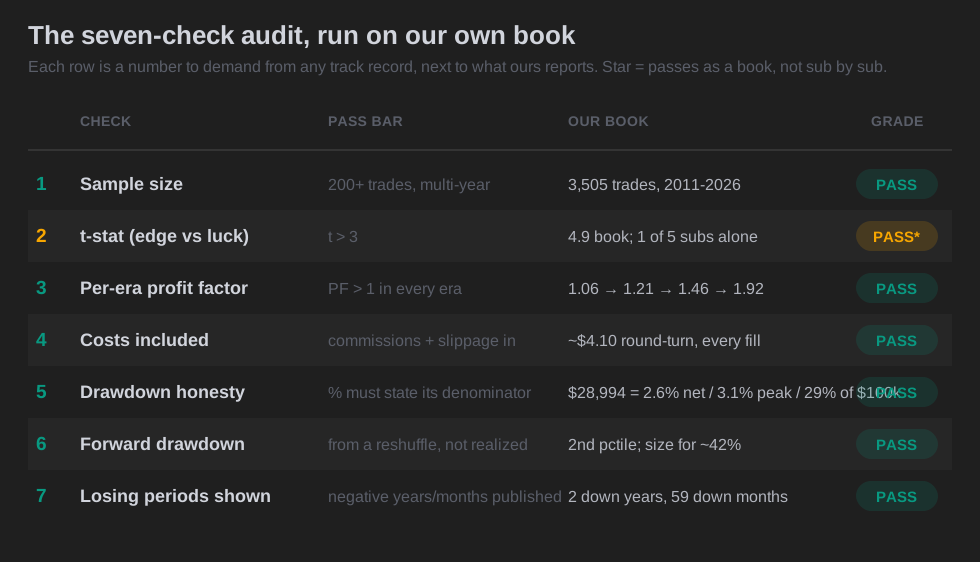
Whose track record is this (read this first)
The numbers below come from the STS NQ book, our own backtested record. Five systematic NQ strategies run as one portfolio that holds a single position at a time. TradingView backtests, 2011 to 2026 (data as of August 5, 2026), one to three contracts scaled by volatility, commissions and slippage included, $1,112,232 net over 3,500 trades on the NQ mini. The style is momentum and trend continuation, intraday plus one overnight model. Not mean reversion, not scalping.
That matters for how you read this. The seven checks transfer to any record, yours included. The exact numbers do not. When you run these checks on a signal seller, a prop firm demo, or your own backtest, you will get your own answers. We are using our book as the worked example of what each check looks like when someone actually shows their homework.
Check 1: a few hundred trades is the floor, a hot month proves nothing
Ask how many trades the record covers, over how many years.
A handful of trades can look brilliant on luck alone. The more trades a record has, the harder it is for luck to carry the whole thing. The rough floor is a few hundred trades across more than one market condition, so a bull run, a chop year, and at least one drawdown are all in the sample.
Our book is 3,500 trades from 2011 to 2026. That count reconciles three independent ways in our export: exit rows, entry rows, and the running cumulative column all land on 3,500. Fifteen years covers two bear markets, a crash, and several flat stretches. This check is the easy one. If a seller can only show you last quarter, stop there.
Check 2: the t-stat, the one number hardest to fake
Ask for the t-stat. It is a single number that says how far a record sits above pure luck.
The t-stat measures the average trade against how noisy the trades are. A high number means the profit is unlikely to be a fluke. Harvey, Liu and Zhu studied thousands of published strategies and argued the old bar of 2.0 was far too soft once you count how many things people test before they publish a winner. Their tougher line is t over 3.
Our book clears the 3.0 bar comfortably. On a dollar-PnL basis it clears by even more. But here is the honest part almost no vendor shows you: run the same test on each of the five strategies alone and only one clears the bar.
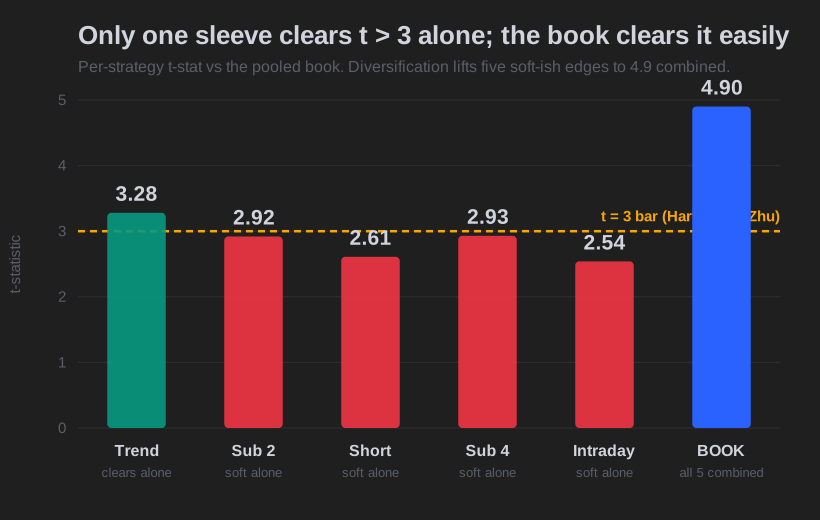
The per-strategy t-stats are 3.28, 2.92, 2.61, 2.93, and 2.54. Only the first, our trend sleeve at 3.28, passes 3 standing alone. The other four are soft on their own. We keep them because they run together, one position at a time, and the diversification lifts the combined book well clear of the bar. Two of them, the short at 2.61 and the intraday sleeve at 2.54, would be flagged by a strict auditor applying this check sub by sub. We would rather you see that now than find it later.
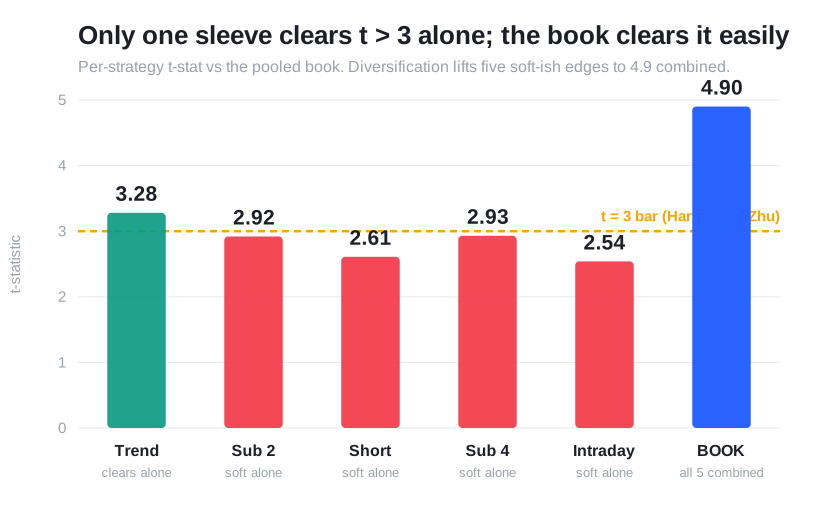
Here is why the t-stat is the check that matters, not the friendlier ones. Every one of our five sleeves makes money standing alone, with profit factors from 1.32 to 2.12. Judge them on profit factor and you would call all five winners. Judge them on the t-stat and four of the five fail. Profit factor tells you a strategy made money in the past. The t-stat tells you whether that money is likely to be edge instead of luck. A record that leads with profit factor while staying quiet about the t-stat is showing you the softer number.
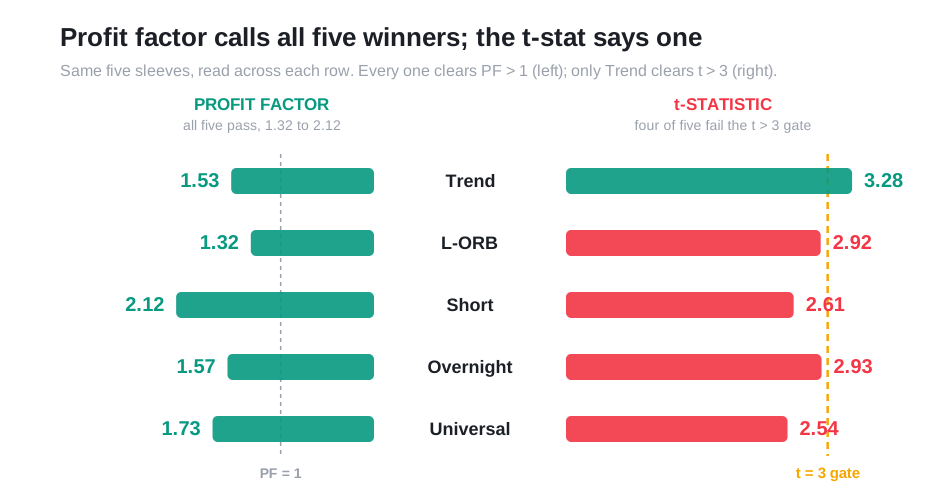
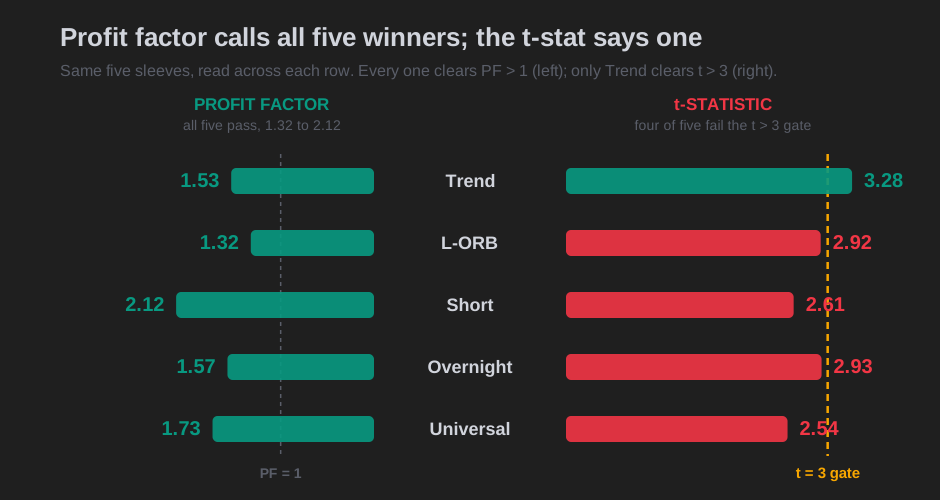
So why keep the soft-t sleeves at all? Because they cover ground the trend sleeve cannot. The book is net-positive in all five market regimes we cut it into. The short sleeve, the one that reads a soft 2.61 alone, is what carries the crashes: in the crash and high-volatility-down months it produced the large majority of the book's profit while the long sleeves lost money there. That is why a soft solo t-stat can still earn its seat. The full breakdown is in is my backtest overfit. (That regime split runs on the 3,270 trades our map covers, through May 2025. The direction holds; the exact dollars we hold back until the map is extended.)
So this check has a subtle rule. Demand the t-stat for whatever you are actually going to trade. If someone sells a single strategy, its solo t-stat is the one that counts. If they sell a book, the book number is fair, but a good one will still show you the parts underneath.
Check 3: profit factor in every era, not just the total
Ask whether the edge held up in each stretch of history, or whether one lucky run carries the whole record.
Profit factor is gross wins divided by gross losses. Above 1.0 means the period made money. A single aggregate profit factor can hide a record that made everything in one wild year and bled the rest of the time. The fix is to cut history into equal blocks and check every one.
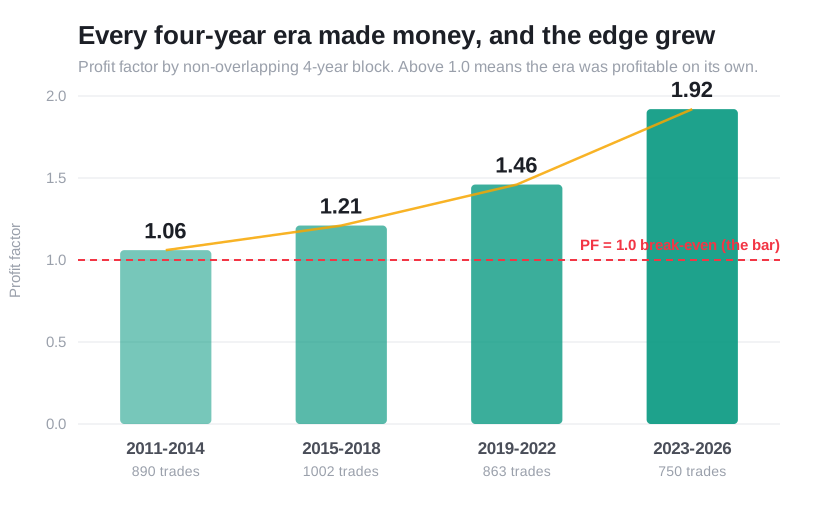
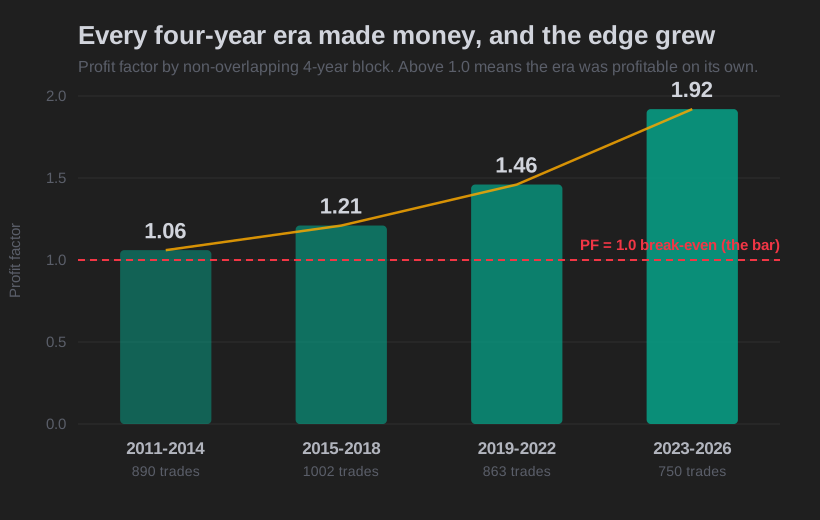
Split into four equal four-year eras, our book reads 1.01, 1.20, 1.45, and 1.86. Every block made money. The earliest is thin, barely above break-even on 868 trades, and we will say that plainly rather than round it up. But the trend runs the right way. A curve-fit strategy usually looks best on the data it was built on and decays as it ages. Ours strengthens. That is the pattern this check is built to find, and the thin early era is the honest cost of showing it.
Check 4: a record that will not name its cost per contract is hiding one
Ask whether commissions and slippage were subtracted, and get the per-contract figure.
This is where a lot of records quietly cheat. A backtest with zero costs can turn a losing strategy into a winning one, especially a high-frequency one. The tell is a record that will not name its cost assumption. A real one gives you a number.
Ours is about $4.10 round-turn, applied to every fill. That is the configured, observed cost from our execution calibration, and our net P&L is post-cost by construction, so the $1,112,232 you see already has it taken out. One honest limit: a post-cost export cannot regenerate the exact gross-to-net figure by itself, so we cite $4.10 as the observed assumption, not something re-derived from the trade list. The point of the check is not the exact number. It is that a serious record can tell you the number at all, and a scalping strategy that skips it is selling you a fantasy.
Check 5: a drawdown percentage means nothing without its denominator
Ask what the drawdown percentage is divided by. The same dollar loss can be three very different percentages.
This is the check most people skip, and it is where a lot of marketing hides. A drawdown is the worst peak-to-trough drop in equity. The dollar figure is objective. The percentage is a choice, and the choice can flatter or scare depending on what sits in the denominator.
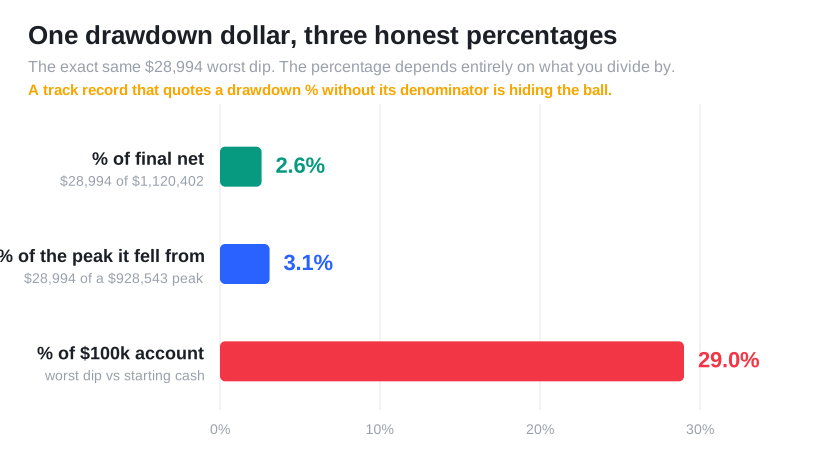
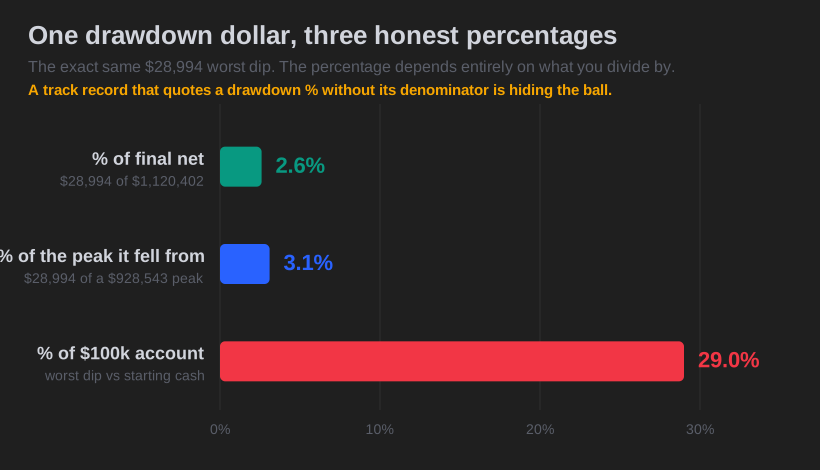
Our worst dollar drawdown was $51,836. It fell from a peak of $1,216,816, so against that peak it is 4.3%; against the final $1.11M net it is a small 4.7%; against a $100k starting account it is 52%. Same dollar figure, three honest percentages, and a marketer would quote the 4.3%. Keep the denominators straight and do not let a big-account percentage get quoted as a small-account one. Our largest percentage drawdown is a separate, earlier episode: 20.4%, the figure on our tear sheet, which was a ~$20,573 dip on a ~$100.7k account early in the book, in 2011, measured against the account's peak equity at the time. The check is simple: if a record shows a drawdown percentage and will not say the denominator, treat the number as marketing until proven otherwise.
Check 6: the drawdown to plan for, not the one path the record happened to take
Ask for the drawdown a reshuffle of the trades implies, not the single number the backtest happened to produce.
The realized drawdown is one roll of the dice. It depends heavily on the order the trades arrived in. Cluster the losers and the dip is deep. Spread them out and it is shallow. The backtest shows exactly one order, the one history dealt. A fair audit asks what a normal order would have produced.
We took our backtested trades and reshuffled the sequence 10,000 times. Our backtested $51,836 drawdown, 52% of a $100k account, landed at the 72nd percentile of that distribution, meaning about 28 of every 100 reshuffles drew down worse than the backtest did. The median reshuffled drawdown is shallower than what the backtest produced, $45,379, about 45% of a $100k account, and a bad-but-normal one is deeper, $67,838, about 68%. So the honest planning figure is the 95th percentile, not the realized figure and not the median.
We ran a second, stricter reshuffle to check that number. The simple shuffle treats every trade as independent, which can overstate the tail because it breaks up the losing streaks that actually drive drawdowns. So we also used a block reshuffle that keeps each losing streak intact. It comes out kinder to us at every percentile. We are not quoting its exact figures, because re-running it moves them by more than we are willing to call reproducible, and a number we cannot reproduce has no business in an audit article. The direction is the finding: the simple shuffle is the conservative one, so it is the band we size against.
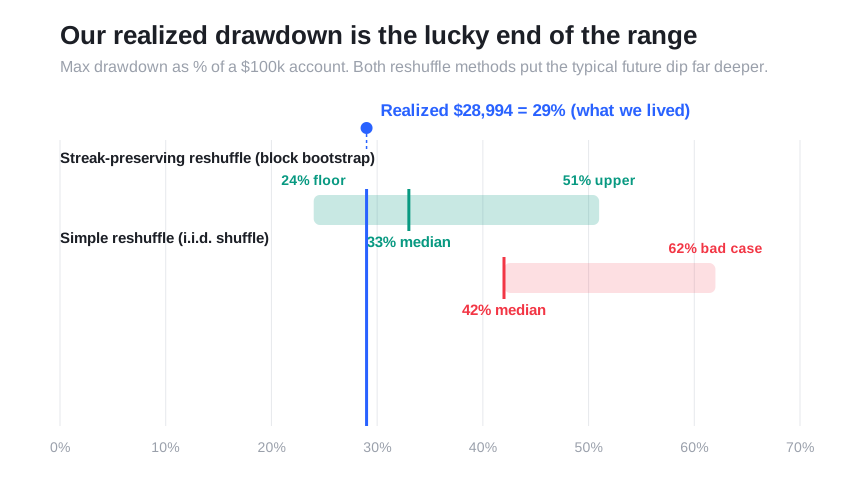
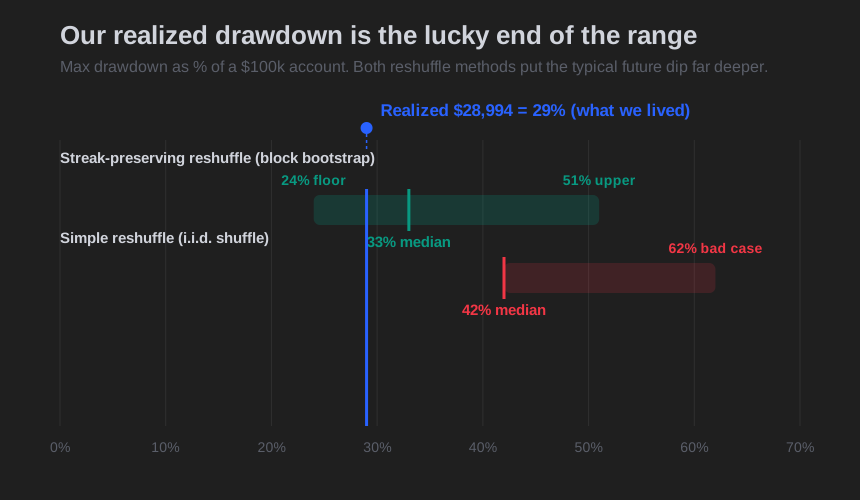
A record that quotes only its realized drawdown is showing you one draw dressed as a limit. The full method, and why the edge is still real either way, is in expect a worse drawdown than your backtest.
Check 7: the losing periods, shown not hidden
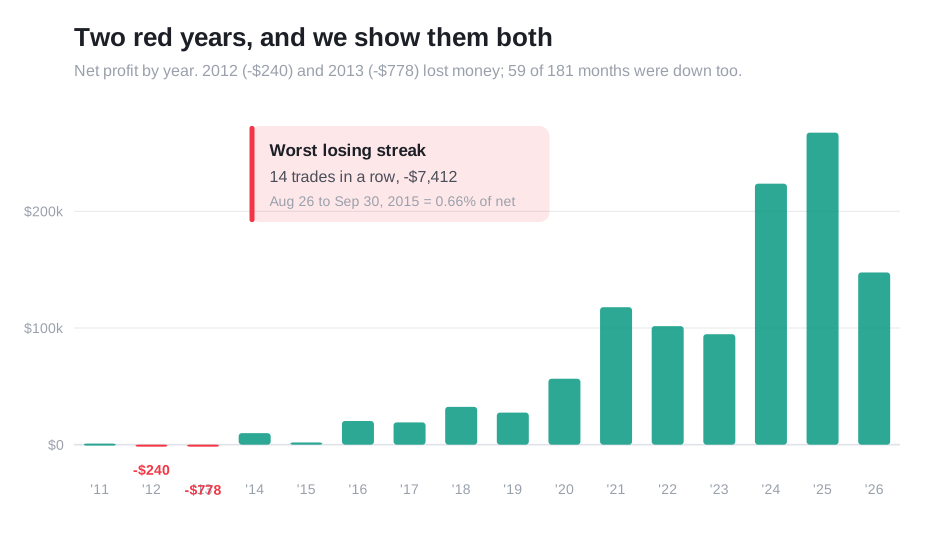
Ask to see the down years and down months. A record with no red in it is either very short or not telling you everything.
Real edges lose regularly. Ours wins 45.5% of trades, so it loses more often than it wins, and the profit comes from wins being bigger than losses. Over 15 years the book had three negative years, 2011 at -$4,889, 2012 at -$240, and 2013 at -$2,899, and 63 negative months out of 181. The worst losing streak was 14 trades in a row for -$7,412, from August 26 to September 30, 2015, which is 0.67% of total net. None of that is hidden, because a record that only shows green is hiding the half of the data that tells you whether you can actually sit through it.
The eighth thing to demand: a disclosure the checks cannot catch
There is one more thing to ask for that no scorecard captures, and it is not a grade. It is a disclosure. Ask whether the numbers can move when the underlying data gets re-based.
Continuous futures contracts get stitched together across rolls, and each roll re-bases the price series a little. So the exact same unchanged strategy prints slightly different totals on different runs. Our published book is $1,112,232 over 3,500 trades, exported on August 5, 2026. That export is a re-run of the identical, unchanged rules on a re-based continuous series, and it printed a different net, a different trade count and a different drawdown than the run before it did. Nothing changed in the strategy. The data underneath moved, so every figure on this page carries the date of the export it came from.
This is why a screenshot of a number is weaker evidence than a live script on a chart. A screenshot cannot show data re-basing; a re-runnable process can. This is the same line that separates a real signal record from a highlight reel, which we lay out in are futures trading signals worth it. A track record that never mentions this, or that treats one screenshot as gospel, has not told you how its own numbers behave.
The one honest limit
Two of our five strategies do not clear the t-over-3 bar standing alone. The short reads 2.61 and the intraday sleeve reads 2.54. We keep both for the jobs they do inside the book, correlation and coverage of conditions the other sleeves sit out, not because either is a bulletproof solo edge. An auditor applying check 2 strictly to each piece would flag two of ours, and they would be right to. We would rather you know that than discover it later.
Copy this checklist and run it on anyone
Paste these seven lines into your notes and point them at the next track record someone shows you, ours included.
- 200+ trades over 3+ years?
- t-stat over 3 for the thing you will actually trade?
- Profit factor above 1 in each 4-year era, not just the total?
- Costs subtracted, and can they name the per-contract number?
- Drawdown percentage, and what is the denominator?
- Planning drawdown quoted from a reshuffle, not the realized best case?
- Losing years and months shown, not hidden?
The honest providers answer with numbers. The rest change the subject to testimonials and one good week.
How we measured this
Instrument: CME Nasdaq-100 E-mini (NQ), continuous contract on TradingView, $100,000 starting capital, no compounding, one to three contracts scaled by volatility. Window: 2011 to 2026 (data as of August 5, 2026). Fills modeled with TradingView's bar-magnifier; commissions and slippage in every trade at about $4.10 round-turn. The book is five live sub-strategies run as one single-position portfolio; a sixth, earlier sleeve was retired and is excluded.
Every book-level figure reconciles on the raw net-PnL column three independent ways: exit rows, entry rows, and the cumulative column all agree on 3,500 trades and $1,112,232. The per-era profit factors, the negative-year and negative-month counts, the worst streak, and the drawdown come from the same export, recomputed by the scripts in our research folder. The reshuffled-drawdown figures come from a 10,000-iteration simple trade shuffle (median 45% of a $100k account, 95th percentile 68%); a streak-preserving block bootstrap runs below it at every percentile and is reported qualitatively only. The rebase figure is a fresh August 5, 2026 re-run of the identical book.
The limits, plainly. These are hypothetical backtest results, not live fills, so they inherit the engine's assumptions. The two reshuffles in check 6 disagree because the simple shuffle breaks up losing streaks while the block method keeps them, so the honest planning drawdown sits at or below the simple shuffle's band rather than above it. The exact $4.10 cost is the configured assumption, not something re-derived from the post-cost export. And the whole record leans on a recent, trend-friendly regime for the Nasdaq. The real risk to a book like ours is not a fake edge; it is a change in market character the past did not contain.
What to do with this
Run the seven checks on us before you trust anything else on this site. The full stat block behind every number here is on the tear sheet, and the five strategies, each with its own equity curve, are on our strategies page. If our book clears your version of these seven checks, the same systems send their entries as real-time signals, and plans are on the pricing page. We would rather you grade the receipts first than take our word for it.
We trade this book live and sell access to the signals, so judge the data accordingly. This article is educational and is not investment advice. Futures trading involves substantial risk of loss and is not suitable for every investor.
Hypothetical performance disclaimer (CFTC Rule 4.41): hypothetical or simulated performance results have certain limitations. Unlike an actual performance record, simulated results do not represent actual trading. Also, since the trades have not been executed, the results may have under- or over-compensated for the impact, if any, of certain market factors, such as lack of liquidity. Simulated trading programs in general are also subject to the fact that they are designed with the benefit of hindsight. No representation is being made that any account will or is likely to achieve profit or losses similar to those shown. Past performance does not indicate future results.