Are Futures Trading Signals Worth It? A Buyer's Checklist
Most futures trading signals are not worth paying for. The reason is simple. Most services cannot show you a documented, multi-year record with every trade, every loss, and the real drawdown included. A signal is only worth its price if the proof behind it survives a few hard questions. Most never even get asked.
So here is the buyer's checklist. Seven things a serious futures signal service should be able to show you before you pay. We use our own NQ book as the example of what "good" looks like, but the checklist is yours to point at any provider. Including us.
Whose numbers are these (read this first)
These figures come from our own book. Five systematic NQ strategies run as one single-position portfolio, one trade on at a time. They are TradingView backtests from 2011 to 2026, sized at one to three contracts by volatility, with commissions and slippage included. The total is $1,112,232 net on the NQ mini. The style is momentum and trend continuation, not mean reversion and not scalping.
That context matters. These are our system's results, not a rule about the NQ market itself. You cannot take our exact numbers and expect them from a different strategy. What you can take is the method. The checks we run on ourselves are the ones you should run on anyone selling you signals. The proof standard transfers even when the numbers do not.
The whole checklist on one screen
Before the details, here is the full list, with what our book reports for each line.
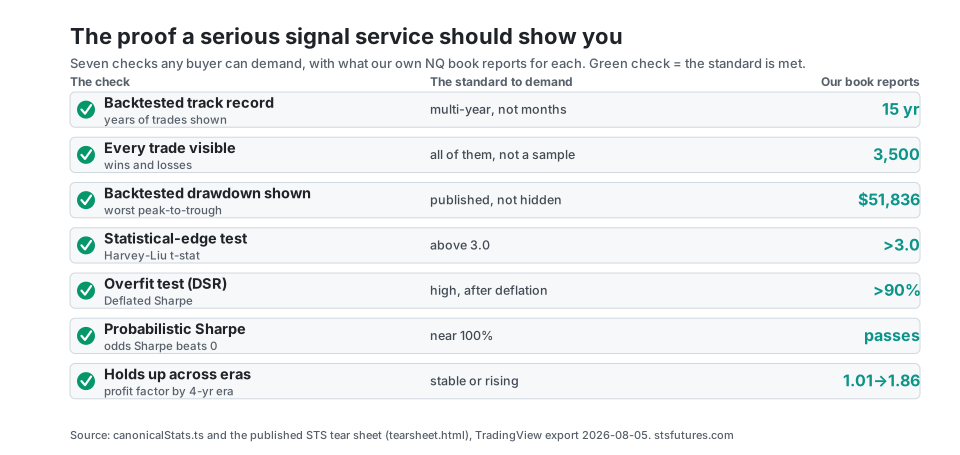
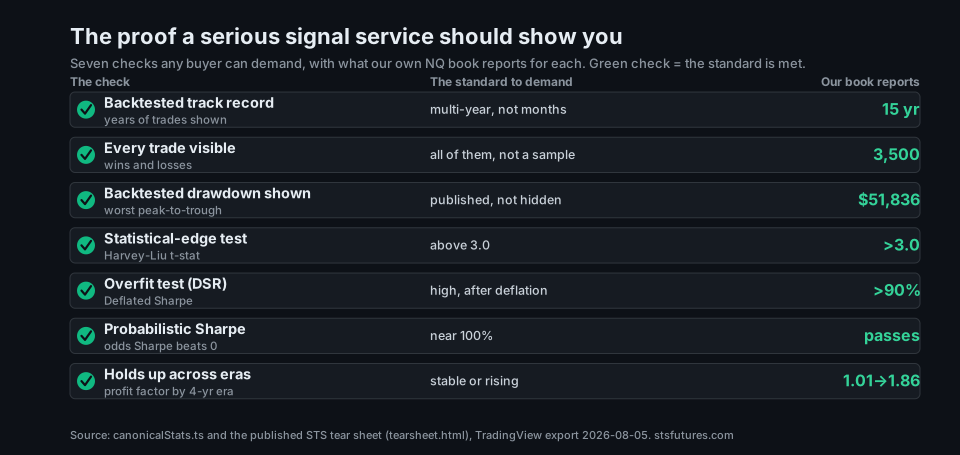
Now the seven, one at a time.
A track record measured in years, not weeks
Ask how long the record is. A good answer is years of trades, not a hot streak from last month.
Anyone can post a great month. Markets hand out lucky streaks for free. What is hard to fake is a result that holds through a bull market, a crash, a chop year, and a few drawdowns. Our record runs 15 years, 2011 to 2026. If a service can only show you the last few weeks, you are not buying an edge. You are buying a coin flip with a nice chart. The same arithmetic cuts against us too: a month of our own signals is far too small a sample to judge our edge, which is why we publish the full record.
Years alone are not proof either. A long record can still be curve-fit to the past, which is why the checks below test exactly that.
Every trade, including the losers
Ask to see all the trades. Not the highlights. All of them, with the losing ones in plain sight.
Our book is 3,500 trades. We win 45.5% of them. That number surprises people who expect a "winning system" to win most of the time. It does not.
The edge is not in being right often. It is in the size of the wins against the losses. Our average win is about $1,979. Our average loss is about $1,067. So a winning trade is worth about 1.9 times a losing one. That payoff is the edge, not the hit rate.
And you can only judge it if the losers are on the table next to the winners. A service that shows you only winning trades is hiding the half of the data that matters.
The real drawdown, not a soft version of it
Ask for the worst peak-to-trough loss. The single deepest hole the account fell into, in dollars.
Ours is $51,836 on the NQ mini book, about 4.3% of the peak it fell from (our worst in percentage terms was a separate, earlier 20.4% episode). We publish it on the tear sheet, and we tell buyers what a reshuffle of those same trades says about it: at the 72nd percentile, roughly seven in ten alternate orderings came out better, so the number the backtest produced is already a rougher-than-typical draw. The tail is deeper still. One ordering in twenty ran past $67,838, and that is the figure an account has to survive. We unpack why your live drawdown usually beats the backtest in expect a worse drawdown than your backtest. A service that talks only about returns and goes quiet on drawdown is selling you the upside and hiding the part that actually decides whether you can stick with it.
The one number that is hardest to fake
Ask for the t-stat. It is a single number that says how far a record sits above pure luck.
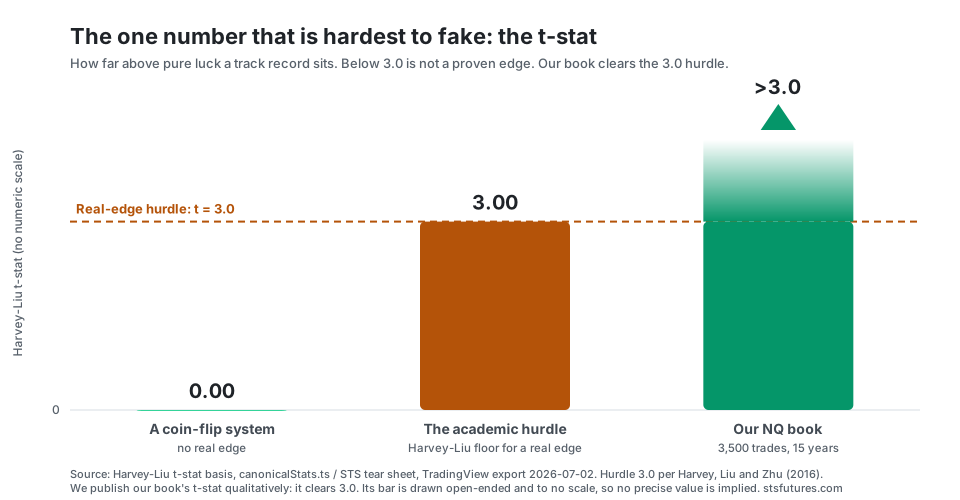
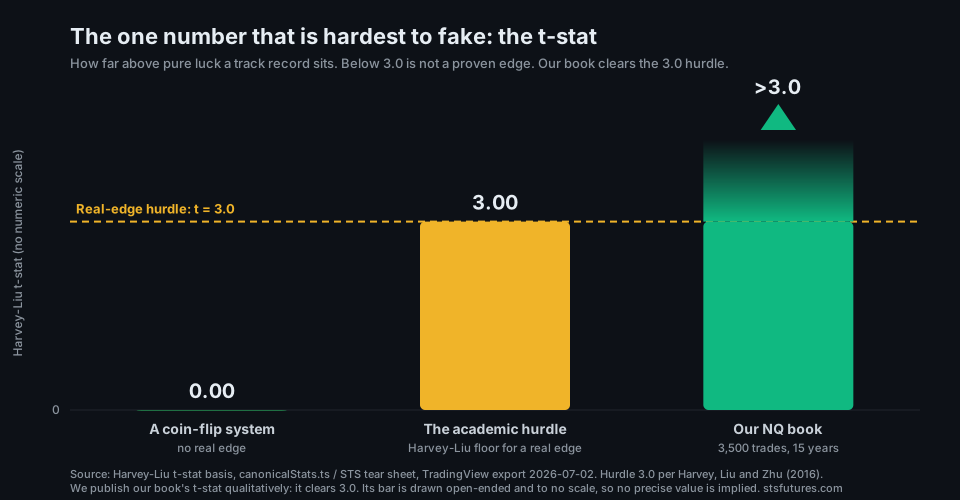
Here is the rule. Below 3.0, a record could easily be luck. Above 3.0, it probably is not. That 3.0 bar comes from Harvey, Liu and Zhu, who studied thousands of strategies and found the old bar for "real" was set too low.
Our book clears that 3.0 bar. The number is adjusted so a big trade count alone cannot inflate it. Most services have never run this test and could not tell you their number if you asked. That alone tells you something.
A test for the most common trap: overfitting
Ask whether the strategy was overfit. Overfitting is when a system is tuned so tightly to the past that it looks brilliant on old data and falls apart on new data. It is the single most common way backtests lie.
There are real tests for it, and a serious provider has run them. We did. The Deflated Sharpe ratio strips out the credit a strategy gets just for being one of many tries. Higher is better, and ours clears the 90% bar after deflating for 3,000 variations. A second check, the Probabilistic Sharpe, passes as well: the chance the true edge sits above zero is effectively certain. We clear both.
Neither test is magic, and we run them on ourselves, so check them on the tear sheet rather than take our word for it. We go deeper on these exact tests in how to tell if a backtest is overfit. A service that has never heard of them has not done the homework you are paying for.
Proof that it works on data it never saw
Ask how it did out of sample. That means: build the system on one slice of history, then test it on a slice it never touched. If the edge only exists on the data used to build it, it is not an edge.
We carved out 2026, data the system was never built on, and tested every strategy on it cold. All five made money out of sample, including the one that looks statistically weakest on its own. The profit factor also rises across four consecutive 4-year eras, from 1.01 to 1.86, rather than fading. That is the difference between a strategy that found something real and one that got lucky on a single stretch of history.
Its own edge, not just the market going up
Ask whether the returns are really just the market. If a futures system only makes money when the index rises, you are paying a subscription for something a cheap index fund does for free.
Our beta to NQ is withdrawn while we re-derive the benchmark regression it came from, so we will not quote a number we cannot currently stand behind. What we can show is the spread inside the book. The five strategies inside the book also barely move together, with longs, a short, and an overnight model that win and lose at different times. That spread is why the combined book is steadier than any one piece. A service whose "edge" is really just buy-and-hold in a costume is not worth a monthly fee.
What this checklist cannot do
Be honest about the limits, because we are. Passing these checks does not promise a profit. It cannot. Every number here is hypothetical backtest performance, and the future can always break a pattern that held for 15 years.
Our own record has a weak spot we say out loud. The profits are heavy in the recent years, 2020 through 2025, which were strong for the Nasdaq trend our system rides. The real risk to a system like ours is not a fake edge. It is a change in market character that the past did not contain. A checklist tells you whether a provider has done honest work. It does not tell you tomorrow will look like yesterday. Anyone who promises that is the first to walk away from.
A futures signal is worth paying for only if the proof survives questions. Demand a multi-year record, every trade including losses, the real drawdown, a t-stat above 3.0, an overfitting test, out-of-sample results, and proof the edge is not just the market rising. If a provider cannot show these, the honest answer to "is it worth it" is no.
How we measured this
Instrument: CME Nasdaq-100 E-mini (NQ), $100,000 starting capital, no compounding. Size starts at one contract and scales to two or three when volatility allows, so the dollar totals already include the size that was on.
Data: our live five-strategy intraday book, backtested on TradingView, 2011-08-11 through 2026-08-05, 3,500 trades, with commissions and slippage included. The book-level figures (trades, win rate, net P&L, profit factor, drawdown) match the numbers published across this site.
The validation numbers come from standard tests on those trades: the Harvey-Liu t-stat, the Deflated Sharpe ratio, the Probabilistic Sharpe, a cold out-of-sample check on 2026 data for every strategy, the per-era profit-factor trend, and a regression against NQ for beta. The drawdown Monte-Carlo reshuffles our backtested trades thousands of times to estimate an honest planning range.
These are derivations from backtested TradingView trades, not a fresh simulation, so they inherit the engine's fills. The limit is the one we stated: heavy reliance on a recent, trend-friendly regime.
What to do with this before you pay anyone
Take the seven checks and use them as questions in your next email to a signal provider. Ask for the multi-year record, the full trade list, the real drawdown, and the overfitting and out-of-sample work. Watch what happens. The honest ones answer with numbers. The rest change the subject to testimonials and screenshots of one good week, and a screenshot cannot be re-run, which is why we hand over the running script instead of a picture.
Run the same questions on us. Our full numbers, drawdowns and all, are on the strategy page and the tear sheet, and the same record laid out against this checklist is on our NQ futures signals page, with the full 15-year record. The stop-loss and drawdown work we publish lives in how many points a stop should be and how long our drawdowns last. If you want the actual NQ entries from the five systems measured here, the pricing page has the plans. We would rather you check the proof first than take our word for it.
We trade this book live and sell access to the signals, so judge the data accordingly. This article is educational and is not investment advice. Futures trading involves substantial risk of loss and is not suitable for every investor.
Hypothetical performance disclaimer (CFTC Rule 4.41): hypothetical or simulated performance results have certain limitations. Unlike an actual performance record, simulated results do not represent actual trading. Also, since the trades have not been executed, the results may have under- or over-compensated for the impact, if any, of certain market factors, such as lack of liquidity. Simulated trading programs in general are also subject to the fact that they are designed with the benefit of hindsight. No representation is being made that any account will or is likely to achieve profit or losses similar to those shown. Past performance does not indicate future results.