Run the strategy on your own chart, or trust screenshots
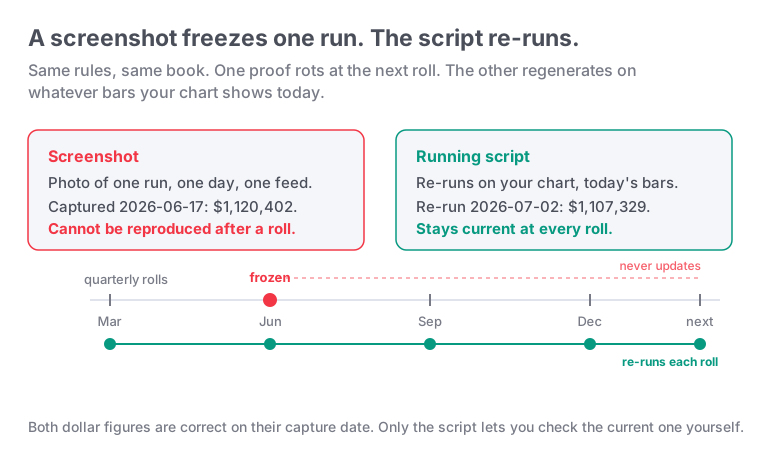
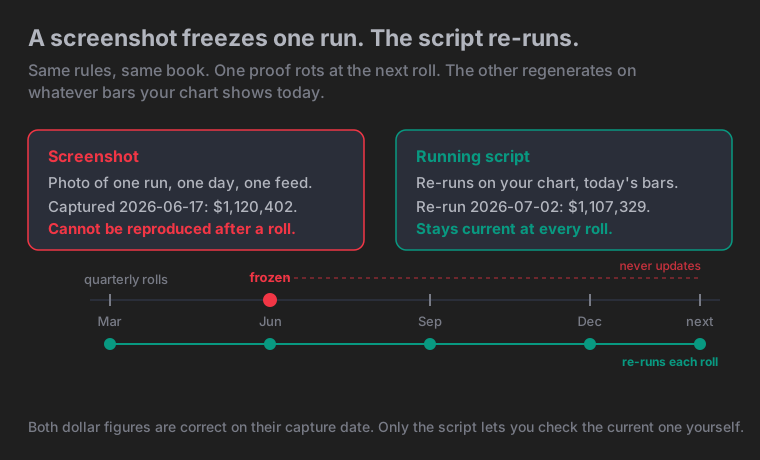
The STS NQ book's published tear sheet said +1,120.40% on 3,505 trades when we captured it (TradingView export, 2026-06-17). We re-ran the exact same strategy on 2026-07-02, right after the June NQ contract roll, and it said +1,107.33% on 3,496 trades. Not one rule changed. The data feed re-based itself, the number drifted about 1.2%, and the first screenshot can never be reproduced again. Neither of those two figures is what the tear sheet publishes today, because we have re-run the book again since: the current published set is dated August 5, 2026. This piece keeps the June-to-July pair because that pair is the evidence, captured and labelled on the day. That is why STS hands subscribers the running script instead of a picture.
Both numbers are correct, each true on its capture date. Neither is fake. This piece shows what a screenshot can prove, what it cannot, and why continuous futures data quietly re-writes its own past every quarter.
These are our numbers, but the lesson is not
These figures come from our own book. Five systematic NQ strategies run as one single-position portfolio, one trade on at a time. They are TradingView backtests from 2011 to 2026, sized one to three contracts by volatility, commissions and slippage included. The style is momentum and trend continuation, not mean reversion and not scalping.
The dollar totals are ours and do not transfer to a different system. The lesson does. Any long futures backtest you are shown breathes with the data the same way. The receipts here are two real TradingView exports of the same unchanged strategy, 15 days apart, straddling one roll.
Same rules, two runs, one number that moved
Here is the whole thing on one screen. Same script both times, exported to a per-trade CSV both times, measured the same way both times.
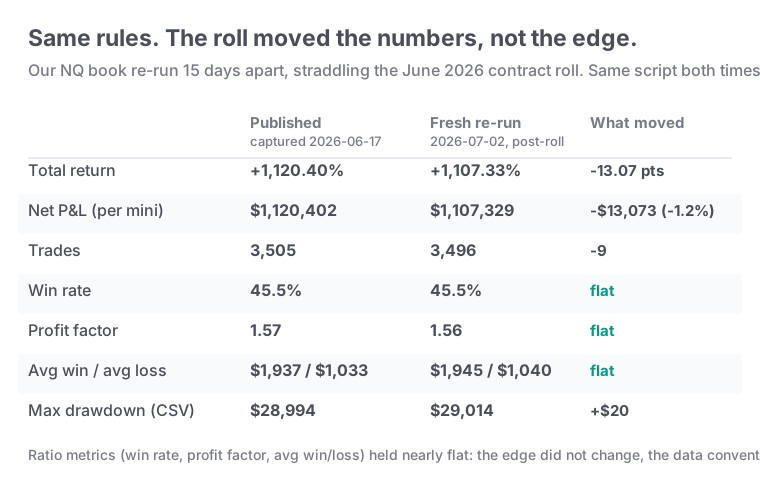
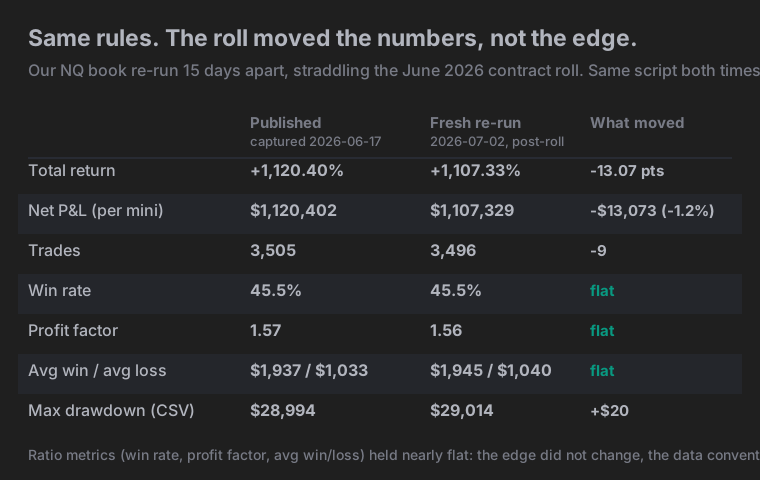
Read the last column. The point total moved a little. The edge did not. Win rate held at 45.5%. Profit factor slipped from 1.57 to 1.56. The average win against the average loss stayed near 1.9 to 1. Those ratios are what tell you whether a strategy has an edge, and they held flat. Only the point-based dollar total drifted, by $13,073 on $1.1 million.
That net trade count is worth a second look, because it hides far more churn than it shows. The count fell by only 9, but under the surface the reshuffle is much larger: 79 old trades dropped out and 70 new ones appeared, so 149 trades in all changed identity as the re-based bars moved past the entry rules. A 45.5% win rate survived that reshuffle intact: 45.54% before, 45.45% after, a gap far too small to be statistically distinguishable (two-proportion z of 0.07). That is the tell: the churn was in the data, not in the edge.
The same drift, seen as percent change per metric, makes the split obvious. One bar moved.
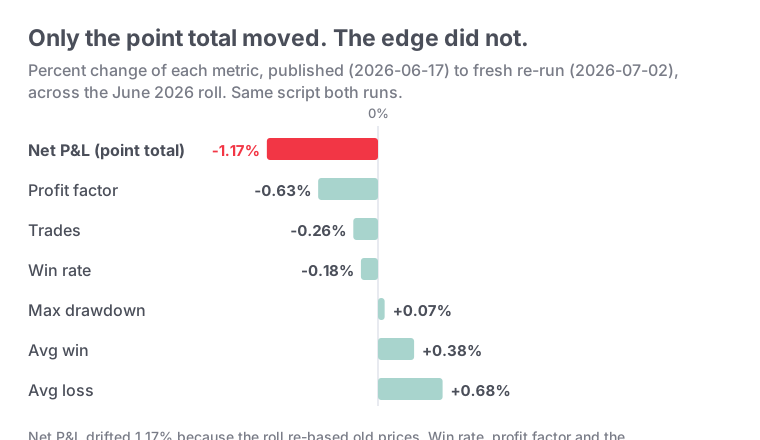
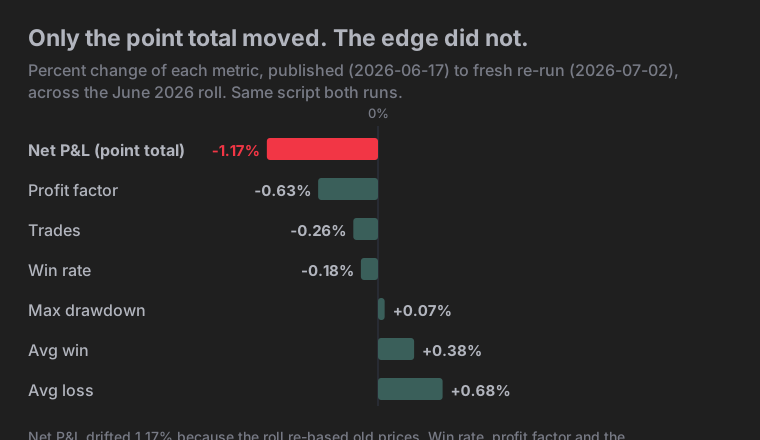
If the strategy had changed, the ratios would move. They didn't. Something else moved the number.
The split is clean enough to sort into two columns. One side is what a quarterly roll re-bases, the point-based dollar total and everything derived from it. The other side is what it leaves alone, every ratio that measures the edge.
| Metric | Published (2026-06-17) | Fresh re-run (2026-07-02) | Change | Re-based by the roll, or held? |
|---|---|---|---|---|
| Total return | +1,120.40% | +1,107.33% | -13.07 pts | Re-based |
| Net P&L | $1,120,402 | $1,107,329 | -$13,073 (-1.2%) | Re-based |
| Trades | 3,505 | 3,496 | -9 | Re-based |
| Win rate | 45.5% | 45.5% | flat | Held |
| Profit factor | 1.57 | 1.56 | -0.01 | Held |
| Avg win / avg loss | $1,937 / $1,033 | $1,945 / $1,040 | ~1.9 to 1 both | Held |
| Max drawdown (CSV close-of-trade) | $28,994 | $29,014 | +$20 | Held |
The point total and its dollar twin moved. Every ratio that tells you whether the edge is real held. That is the whole argument in one lookup: the roll re-writes the units the P&L is counted in, not the strategy that earned it.
What moved was the data, not the strategy
What moved the number was back-adjustment. It is the hinge of this whole piece, and it takes four plain sentences.
Futures contracts expire. To draw one continuous 15-year NQ chart, the data vendor stitches expiring contracts together and shifts the older prices so the seams line up. Every time a new contract takes over, a "roll," the vendor re-shifts the whole history by the new gap. Nothing about your strategy changes, but the price on every old bar moves a little, so point-based P&L on old trades moves a little too, and a few borderline trades flip in or out.
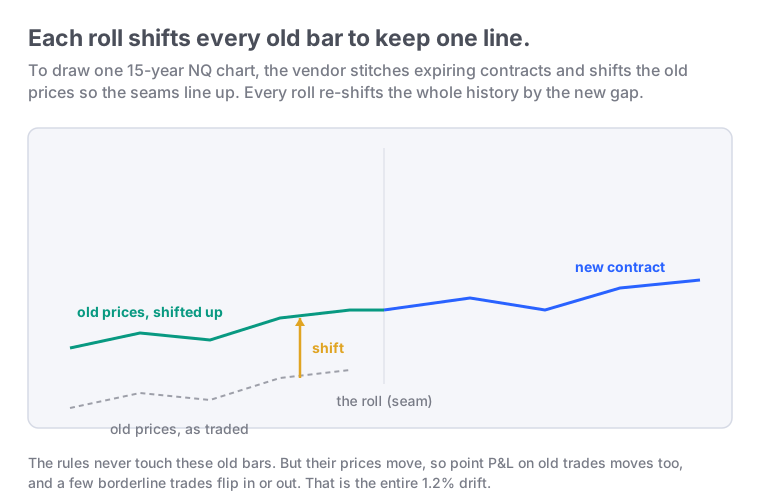
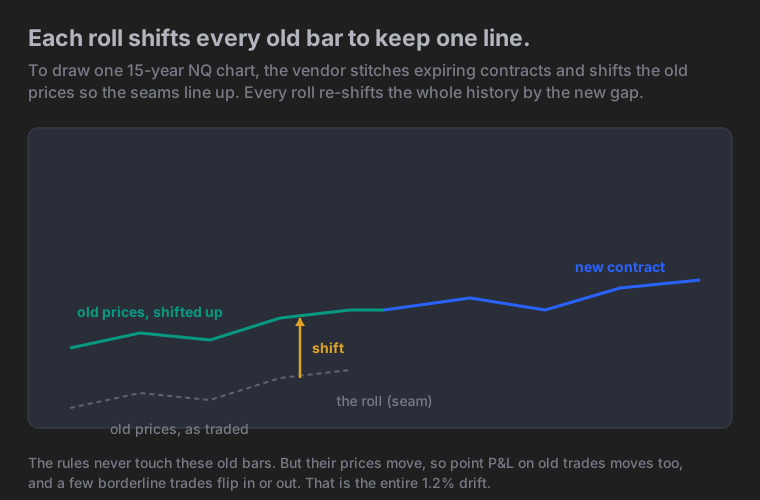
That is why a backtest of unchanged rules is not frozen. It breathes with the data convention. The June 2026 roll re-shifted our NQ history, every old bar moved, borderline trades flipped in and out along the whole series, and the point total came out 1.2% lower.
The proof that this reaches all the way back is the very first trade of the series.
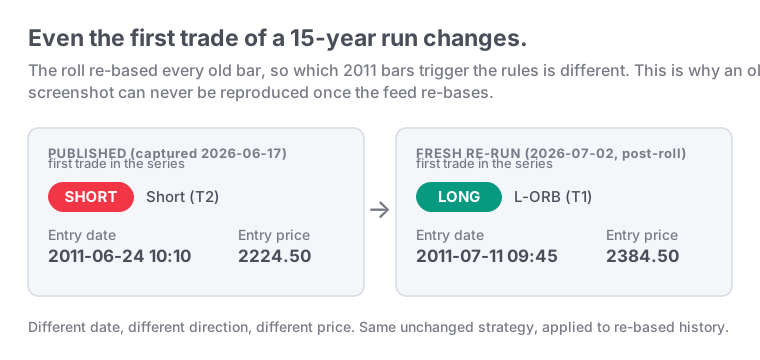
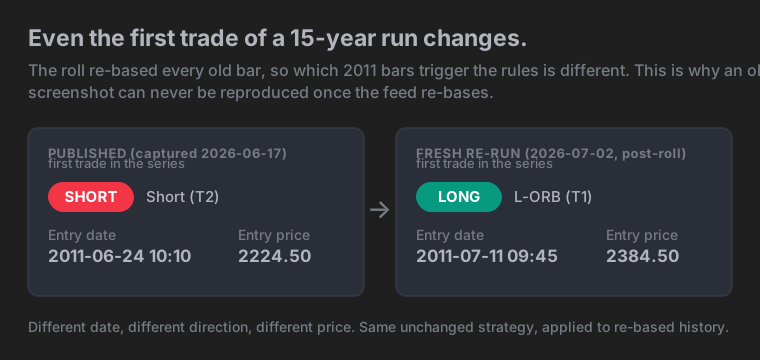
The opening trade of a 15-year run is a different date, a different direction, and a different price. Nothing in the rules touched 2011. The vendor re-shifted the 2011 bars, so which bars trip the entry rules at the start of history changed. The drift is not confined to the recent roll. It runs the length of the series.
The re-basing runs the length of the series, but here is the honest breakdown of where the $13,073 actually came from. Very little of it is price-shift on trades we kept: of the 3,426 trades in both runs, only 80 changed P&L at all, for about $2,700 net. The rest is trades entering and leaving the sample as re-based bars trip or miss the entry rules: 79 dropped trades that had been net-positive cost about $14,000, and 70 new trades added back about $3,600. Only 7 of those new trades are the book simply trading on past the old 2026-06-17 cutoff. So the roll's fingerprint is real and reaches back to 2011, but the dollar drift is driven by which trades qualify, not by re-pricing the ones that stay.
A screenshot is a photo of one run, on one day, on one feed
A screenshot of the STS book's +1,120.40% run is a photo, not a record you can check. It froze one export, on one date, on one vendor's stitch of the data. As of the June roll it is un-reproducible. Nobody can point a chart at today's re-based NQ data and get 3,505 trades and $1,120,402 back. The bars that produced it no longer exist in that exact form.
That is how every continuous futures backtest works, not a flaw we are confessing. But it makes a static image the weakest proof of a track record. It cannot be re-run, it cannot be checked against your own chart, and it cannot show you whether the edge survived the last roll or quietly died in it.
A running script can. Point it at your TradingView chart and it regenerates every trade on whatever bars you are looking at right now, on your feed, at today's vintage. Regenerating and alerting is all it automates, which is the line between what a TradingView script automates and what stays with you. If the win rate and profit factor still hold, the edge held. If they don't, you find out yourself, this week, not from a picture somebody chose to keep.
When we lay out the eight things a signal service should be able to prove, "every trade visible" and "a verified record" both quietly assume the record can be reproduced. A screenshot fails that test. The script passes it. The same "one run is not the whole truth" idea shows up in drawdown too, where we explain why your live drawdown usually comes in worse than the backtest: one history is one draw, not the ceiling.
A backtest screenshot is a photo of one run, on one day, on one data feed. Continuous futures data re-bases every roll, so the same unchanged strategy prints a slightly different number next quarter. Demand the running script or a dated, re-runnable export, not an image.
How we measured this, and where the bases split
Instrument: CME Nasdaq-100 E-mini (NQ), $100,000 starting capital, no compounding, one to three contracts scaled by volatility. Both numbers come from TradingView list-of-trades exports of the same five-strategy book, the published one captured 2026-06-17 and the fresh one run 2026-07-02 after the June roll. Commissions and slippage are already inside the net P&L. We deduped each export to one record per trade, summed net P&L, and rebuilt the equity curve for drawdown. Every figure was cross-checked two independent ways: a second script and each file's own cumulative-P&L column.
One honesty note about bases, because we will not quietly mix them. The TradingView tester panel measures return and drawdown on intra-trade equity; the exported CSV uses close-of-trade. On the fresh run, the panel read about +1,109.98% with a $31,645 drawdown; the CSV of that same run reads +1,107.33% with a $29,014 drawdown. Both are legitimate. The comparison table above uses the CSV on both sides, one consistent basis, so the before-and-after is apples to apples.
The honest limit: this is one roll. One benign re-basing shows the edge survived this roll, not that it survives every roll. The drift cuts both ways, and we cannot promise the next one moves the number by a similarly small amount. A roll that lands in a volatile stretch, or a vendor changing how it stitches, could move it more. That is the point of the script, not a hole in it. It protects you against not knowing, roll after roll. It does not freeze the number. And we cannot hand out the raw historical trade files, which are proprietary, so "run it yourself" means running the licensed invite-only script on your own TradingView chart, not auditing our CSVs.
Verify any backtest screenshot before you trust it
Three things can stand in for a track record, and they are not equal. A static screenshot, a re-runnable script, and a dated per-trade export each prove a different amount. This table is the difference, attribute by attribute.
| Can you... | Static screenshot | Re-runnable script | Dated per-trade export |
|---|---|---|---|
| Re-run it on today's re-based bars | No, frozen at capture | Yes, on your own chart | No, but it fixes the exact vintage |
| Check it against your own feed | No | Yes, bar by bar on your NQ or ES | No, it is the seller's feed |
| Confirm the edge survived the last roll | No | Yes, win rate and profit factor recompute | Only for the date it was cut |
| Reproduce the exact number later | No, the June run is gone post-roll | Yes, to today's vintage | Yes, that one file stays fixed |
| See which data feed and capture date it used | Rarely, unless labeled | Yes, it is your own | Yes, the date is on the file |
A screenshot answers none of these. A dated export at least pins the vintage so the number can be re-derived from that file. Only the running script lets you check the current number on your own chart, roll after roll. That is why STS hands over the script and a dated export, not a picture.
Here is a four-step check you can paste into an email to any signal seller, us included.
- Ask which continuous-contract data feed and symbol the screenshot used, and the exact capture date.
- Ask them to re-run it today and send the new numbers. If they refuse, or the numbers match a month-old screenshot to the dollar, ask why nothing rolled.
- Ask for the running script or an alert feed you can point at your own chart, not an image.
- Re-run it yourself after the next quarterly roll and confirm the edge held: win rate, profit factor, and average win versus average loss, even if the point total drifted.
The honest providers answer with numbers and a script. The rest change the subject to a nicer screenshot. If you want to go a layer deeper and ask whether the edge itself is real, not just reproducible, that is a different test, and we walk through how to tell if a backtest is overfit. The drift here held the edge flat, so overfit is the next fair question, not this one.
Our published record, with its capture date visible, is on the strategy page and the tear sheet. Subscribers get the running script and the alert feed from the same five systems measured here, so they reproduce the current number on their own chart instead of trusting ours; the plans are on the pricing page. We would rather you re-run it than believe a picture.
We trade this book live and sell access to the signals, so judge the data accordingly. This article is educational and is not investment advice. Futures trading involves substantial risk of loss and is not suitable for every investor.
Hypothetical performance disclaimer (CFTC Rule 4.41): hypothetical or simulated performance results have certain limitations. Unlike an actual performance record, simulated results do not represent actual trading. Also, since the trades have not been executed, the results may have under- or over-compensated for the impact, if any, of certain market factors, such as lack of liquidity. Simulated trading programs in general are also subject to the fact that they are designed with the benefit of hindsight. No representation is being made that any account will or is likely to achieve profit or losses similar to those shown. Past performance does not indicate future results.