What actually happens after I subscribe to STS signals?
Short answer. By default, each entry and exit from our five NQ futures strategies reaches you by email as the signal fires and appears on the dashboard's live feed, and you decide whether to take it and place your own orders. Our first live month, July 2026, sent 16 signals and lost $11,755 per NQ contract; through October 2, all 47 live signals together stood at +$845 per NQ contract, both before commissions.
Below are the five steps from payment to your first trade, then every signal from our first live month. Your first month could look like July, so the aim is that you size for a month like it before your first signal arrives.
Which numbers on this page are live, and which are backtest?
Live numbers are signals we actually sent, from July 6, 2026. Backtest numbers are hypothetical: the same five strategies, traded together as one book, simulated on prices of NQ, the E-mini Nasdaq-100 future, since 2011. Its results are simulated, not the signals we sent, even where its dates overlap the live period.
| Live signals | Hypothetical backtest | |
|---|---|---|
| What it is | Alerts we sent in real time | The same rules simulated on past prices |
| Period | July 6 to October 2, 2026 | 2011 to 2026, data as of August 5, 2026 |
| Trades | 47, of which 16 in July | 3,500 |
| Dollar basis on this page | Per contract at alert prices, before commissions | Per contract before commissions, or the 1 to 3 contract book with commissions |
| Traded? | Sent live; fills are each trader's own | No, never traded |
| Where to see it | Every signal on our forward record | The rankings and charts below |
Every chart caption below names which of the two it shows.
What happens, step by step, after I pay?
Five things happen, in this order. Alerts and the dashboard work as soon as you reach the welcome page.
Pay. Choose $50 a month or $500 a year on Stripe's checkout page. You can cancel any time in Settings, and access runs to the end of the period you paid for.
Finish setup and open the dashboard. A welcome page leads into a short setup. In Preferences, email alerts are on by default and you confirm a risk acknowledgement. The last step opens the Portfolio Overview dashboard.
Receive the signal. It reaches you in up to three places:
- Email, from alerts@stsfutures.com, for every entry and every exit. Add it to your contacts to keep it out of spam.
- The dashboard. The Overview page shows the same signal in its Current Positions and Recent Alerts panels, with a pop-up and a sound if the dashboard is open.
- Browser push, optional, switched on under Alerts in Settings.
Settings also lets you mute entries or exits, or set quiet hours. A signal inside your quiet hours is not emailed, exits included.
Read what it says. An entry gives the direction, contract count, price and time in ET. It carries no stop, no target and no strategy name. Our first live entry's subject line began
STS Alert: NQ Long Entry @ $29,921.50. The exit email adds the entry price, the exit price and how long the trade lasted. The dashboard tags which of the five strategies fired.Decide, and place your own order. You choose whether to take the signal and at what size; nothing is placed for you. The contract count in the alert is the book's own size: 1, 2 or 3 NQ contracts, scaled by volatility. One MNQ (micro) contract is one tenth of an NQ (E-mini) contract, so per-NQ dollar figures here divide by ten for 1 MNQ. The exit arrives as its own alert, on the dashboard and by email unless you have muted exits or it falls in your quiet hours.
When in the day do signals arrive?
In our first live month, mostly in the first hour after the 9:30 a.m. ET open: 10 of July's 16 live entries arrived in that hour. Thirteen came in the morning session and 3 in the afternoon.
The book can also trade the overnight session, which opens at 6 p.m. ET, but two of the five strategies, Overnight and Intraday Trend, did not fire in July. From July 6, the book traded on 13 of July's remaining 20 trading days and was silent on 7.
What did our first live month look like?
It lost money. Six of 16 live signals won, and on July 20 the month sat $21,930 per NQ contract below where it started before ending at -$11,755.
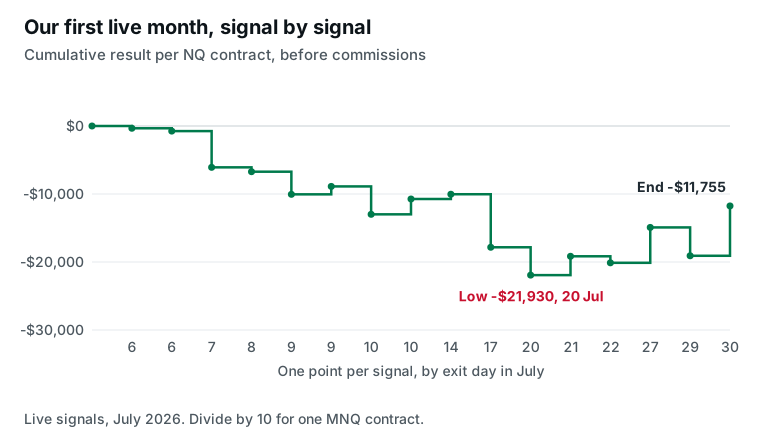
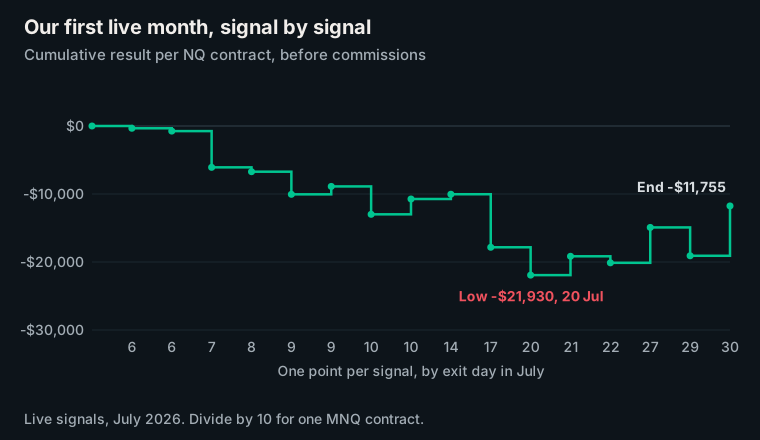
Every row below was sent live and appears on our forward record with its alert time. P&L is per contract, at live alert prices: price points times $20 for 1 NQ and $2 for 1 MNQ, before commissions and fees. The forward record shows each signal at full book size, 1 to 3 contracts, so its dollar figures are larger; the prices are identical.
| Date | Session | Side | Entry | Exit | 1 NQ | 1 MNQ |
|---|---|---|---|---|---|---|
| Jul 6 | Morning | Long | 29,921.50 | 29,904.75 | -$335 | -$33.50 |
| Jul 6 | Afternoon | Long | 29,961.25 | 29,940.50 | -$415 | -$41.50 |
| Jul 7 | Morning | Short | 29,239.50 | 29,506.00 | -$5,330 | -$533.00 |
| Jul 8 | Afternoon | Long | 29,420.25 | 29,388.25 | -$640 | -$64.00 |
| Jul 9 | Morning | Long | 29,858.50 | 29,692.00 | -$3,330 | -$333.00 |
| Jul 9 | Morning | Long | 29,879.25 | 29,937.50 | +$1,165 | +$116.50 |
| Jul 10 | Morning | Long | 29,940.75 | 29,735.50 | -$4,105 | -$410.50 |
| Jul 10 | Morning | Long | 29,948.25 | 30,061.00 | +$2,255 | +$225.50 |
| Jul 14 | Morning | Long | 29,754.25 | 29,789.25 | +$700 | +$70.00 |
| Jul 17 | Morning | Short | 28,420.00 | 28,810.00 | -$7,800 | -$780.00 |
| Jul 20 | Morning | Long | 29,178.25 | 28,973.50 | -$4,095 | -$409.50 |
| Jul 21 | Morning | Long | 29,144.50 | 29,283.00 | +$2,770 | +$277.00 |
| Jul 22 | Morning | Long | 29,236.25 | 29,188.25 | -$960 | -$96.00 |
| Jul 27 | Morning | Short | 28,455.00 | 28,194.75 | +$5,205 | +$520.50 |
| Jul 29 | Afternoon | Long | 28,044.00 | 27,835.50 | -$4,170 | -$417.00 |
| Jul 30 | Morning | Long | 27,976.25 | 28,342.75 | +$7,330 | +$733.00 |
| July | -$11,755 | -$1,175.50 |
About these live results. These are the realised results of our own signal book. They are not the results of any customer account, and no customer return is being reported or implied. Your own results would differ: entry and exit fills, position size, commissions, financing and the decision to take or skip a signal are all yours, and none of them are reflected here. The figures shown are before commissions and fees. Past performance is not indicative of future results. Trading futures involves substantial risk of loss. This alert reports an automated signal from the STS model. It is not individualized investment advice and not a recommendation to buy or sell. You place, size and manage your own orders, and only risk capital you can afford to lose.
By strategy, VWAP Short lost $7,925 per NQ on 3 signals and Opening Range Break lost $6,870 on 7. Trend made $3,040 on 6.
Six wins in 16 is low but not unusual for this book: 45.5% of the 3,500 hypothetical backtest trades won, and 51 of 179 complete backtest months won 37.5% or fewer of their trades.
The five signals after the July 20 low made back $10,175, including July's two best trades. What skipping signals after a loss has cost in our hypothetical backtest is in the cost of skipping trades.
Do the live signals match the backtest?
The entries do: all 16 live entries carried the hypothetical backtest's price and size. Exits cost $1,110 per NQ more live than in the backtest across July, and one exit accounts for more than all of it.
None of these prices is a fill. Live prices are alert prices, and your own orders fill wherever the market lets them. The same 16 trades lost $10,645 per NQ in the hypothetical backtest. That backtest is dated August 5, after these trades, so matching entries show only that the alerts and the backtest run the same rules.
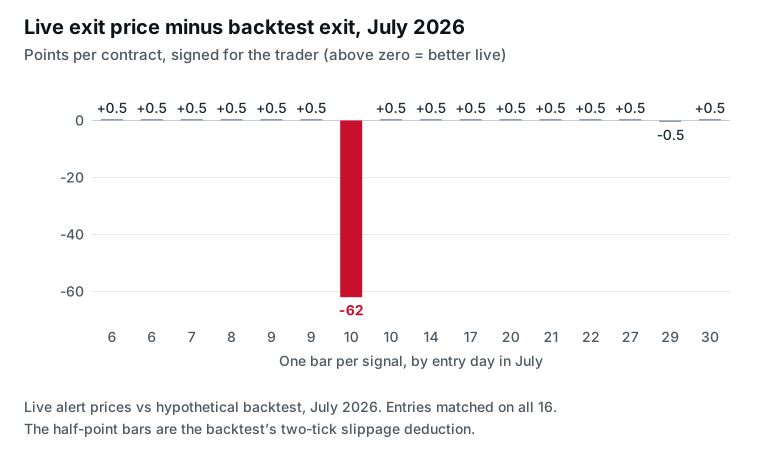
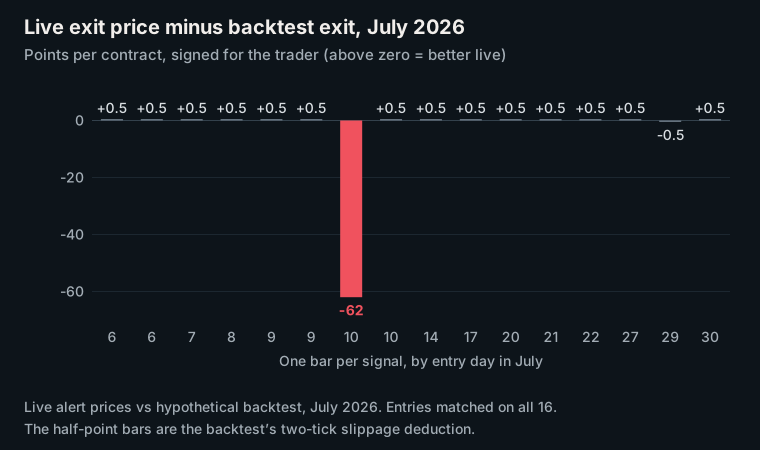
The trade is the first July 10 signal: its live exit came 62 points below the backtest's, which cost $1,240 per NQ ($124 per MNQ).
On 14 of the other 15 exits, the live price is exactly half a point better. That is not a better fill. The backtest deducts two ticks (half a point) of slippage, the gap between a signal's price and the price an order actually gets, and the alert price does not. Net of the one exit half a point the other way, this flatters live July by $130 per NQ.
Was July 2026 a typical month?
No. Against the 179 complete months of our hypothetical backtest, live July ranks second worst per NQ contract, third worst at full book size and 16th worst adjusted for NQ's price, still inside the bottom 10%.
| Basis | Live July | Rank of 179 hypothetical backtest months (1 = worst) | Most recent worse backtest month (hypothetical) |
|---|---|---|---|
| Per NQ contract, before commissions | -$11,755 | 2nd | March 2020, -$14,280 |
| Book size, 1 to 3 NQ, commissions at the backtest rate | -$11,542 | 3rd | February 2022, -$11,638 |
| Share of NQ's price, per contract | -1.98% | 16th (15 of 179 worse, 8.4%) | February 2023, -2.97% |
A point of NQ is worth $20 in any year, but NQ trades many times higher than in 2011, so dollar rankings tilt toward recent months; the last row corrects for that. Losing months are common on any basis: in book dollars, 62 of the 179 hypothetical backtest months (34.6%) lost money.
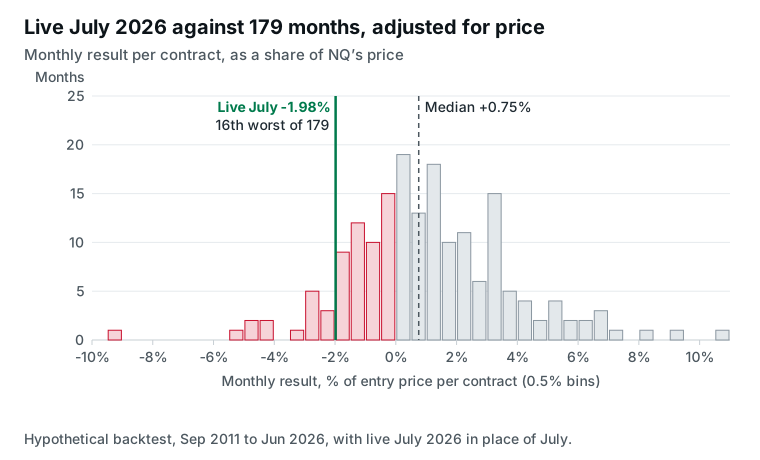
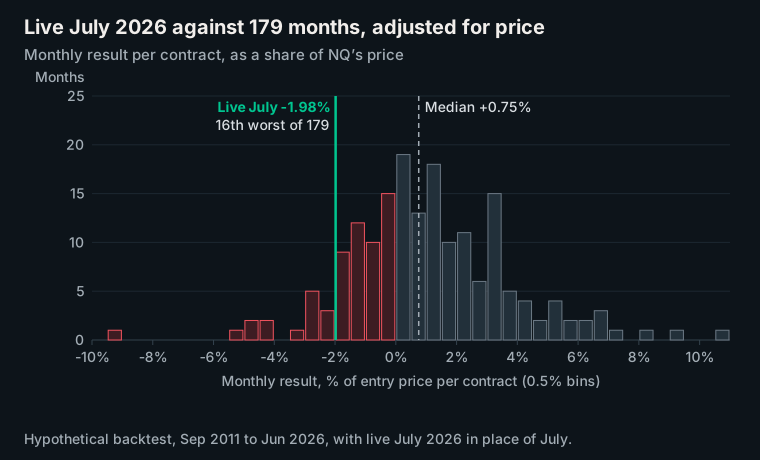
The backtest's own July lost $12,340 at book size and ranks worst, because it adds a July 2 trade from before go-live (-$900 per NQ, never sent) and models the July 10 exit 62 points better.
July's worst trade is also the backtest's largest dollar loss. The July 17 short lost $7,800 per NQ contract live, before commissions. The book traded it at two contracts, and on that basis our hypothetical backtest records a $15,628 loss including commissions, the largest dollar loss of its 3,500 trades. Measured as a share of NQ's price, 13 backtest trades lost more, the worst of them in March 2020.
In our hypothetical backtest, July 20 was also the bottom of its largest dollar drawdown, the drop from a previous high: $51,836 on the 1 to 3 contract book after commissions, from a peak on June 15, 2026. In the backtest, $41,110 of that $51,836 (79%) came from trades entered on or after July 6, the day signals went live. Our bull-market study sets it against the whole record.
One month, good or bad, is far too small a sample to judge an edge, a real long-run advantage.
Where does the live record stand after three months?
Close to flat. Through October 2, the 47 live signals made $845 per NQ contract before commissions ($652 after commissions at our backtest rate of $4.10 per contract), having recovered from the July 20 low.
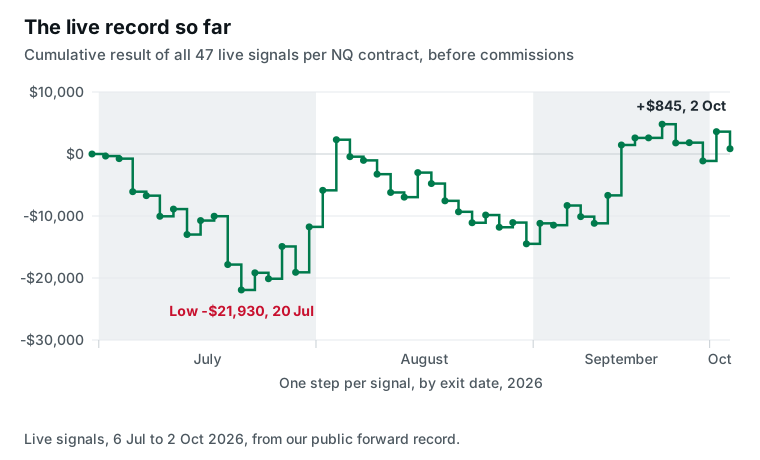
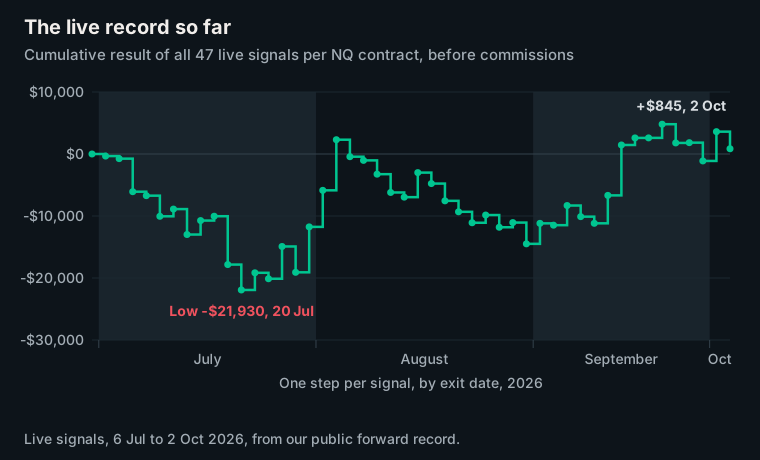
August lost $2,735 per NQ over 16 signals, and September made $13,370 over 13. October's first 2 signals, through October 2, made $1,965.
From July to September, the live signals lost 0.14% of NQ's price per contract. Over 15 years of our hypothetical backtest, 40 of 176 overlapping three-month stretches (22.7%) did worse; overlapping means each stretch starts one month after the previous one. None of the 38 stretches ending after April 2023 did worse. The most recent worse one was February to April 2023.
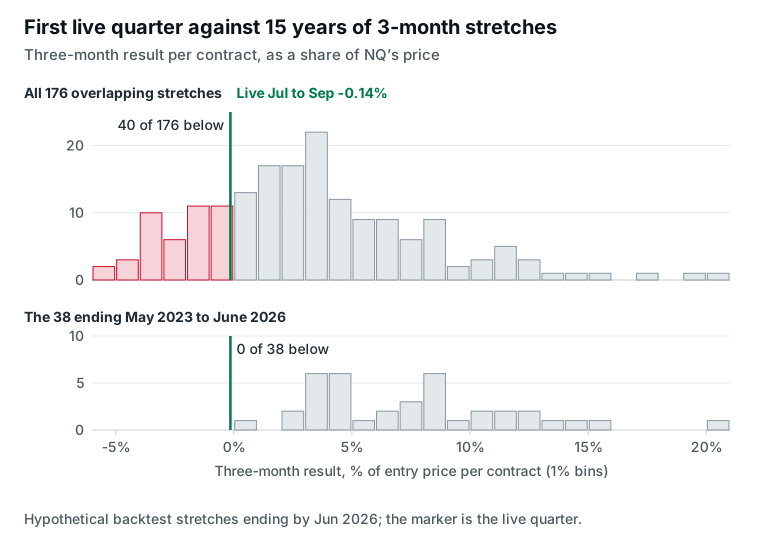
Going live into the backtest's largest dollar drawdown fits bad luck, and it fits a backtest that flatters its recent years. Three months and 47 signals cannot tell the two apart.
What does this mean for my first 30 days?
Expect email alerts that you act on yourself, and size for a month at least as bad as July. Decide before your first signal whether you will take every one.
- Size for July's low. It was $21,930 per NQ and $2,193 per MNQ below the start. If that drop would force you to stop, your size is too large; who STS is not for sets out our recommended minimum account.
- Expect quiet days and losing strategies. Two of the three strategies that fired in July lost money for the month.
- Plan for exits you cannot watch. The entry email carries no stop, and the exit arrives as its own alert at any time up to the close.
How we measured this
Live signals. The public forward ledger behind /forward-record, saved on October 5, 2026: 16 round trips with an exit date in July 2026, from the July 6 go-live onward, and the whole live record, 47 round trips to October 2, 2026, for the three-month figures. Sessions are by entry time: morning before noon ET, afternoon from noon. Strategy subtotals match each live signal to the backtest trade with the same date, direction and entry price.
Backtest. Our backtest of the five-strategy book on NQ, 2011 to 2026 (data as of August 5, 2026), 3,500 trades, $1,112,232 net, 1 to 3 contracts scaled by volatility, commissions included. These are hypothetical results. Months are assigned by exit date. Rankings use the 179 complete months from September 2011 to July 2026. Each ranking puts the 16 live signals in place of the backtest July; the book-size ranking charges the backtest rate of $4.10 per contract. Three-month comparisons use overlapping windows of complete months ending by June 2026. The drawdown is closed-trade: it counts completed trades only.
Excluded. The July 2 pre-launch backtest trade is left out of the live table and totals. Commissions are excluded from per-contract figures and included in book-basis figures.
Hypothetical Performance Disclaimer (CFTC Rule 4.41): These results are based on simulated or hypothetical performance results that have certain inherent limitations. Unlike the results shown in an actual performance record, these results do not represent actual trading. Also, because these trades have not actually been executed, these results may have under- or over-compensated for the impact, if any, of certain market factors, such as lack of liquidity. Simulated or hypothetical trading programs in general are also subject to the fact that they are designed with the benefit of hindsight. No representation is being made that any account will or is likely to achieve profits or losses similar to these being shown.
Past performance is not necessarily indicative of future results. Futures trading involves substantial risk of loss and is not suitable for all investors.
See what STS NQ futures signals are and how they reach you and our forward record, every live signal we have sent, dated and public.