How often do NQ signals fire, and is a quiet week normal?
Short answer. Our NQ book sent 47 live signals in its first 13 full weeks, 3.6 a week, a little below the 4.06 a week our hypothetical backtest averaged over its last 12 months. One week each quarter, around the futures contract roll, it takes no new entries, so a silent week then is normal; outside that week, only 2 of 721 backtested weeks had no signal.
This article shows what a normal week looks like, so a quiet one does not catch you off guard. We use 15 years of hypothetical backtest and our first 13 live weeks to show how many signals a week usually brings, and why and for how long it can go quiet. Throughout, a signal means one trade: you receive an entry alert and, later, its exit alert.
How many signals does a typical week bring?
In our hypothetical backtest, a typical week outside the quarterly roll brought four or five signals; live weeks outside the roll have averaged 3.9 so far. Over 781 whole weeks of hypothetical backtest, the average week brought 4.48 signals; weeks outside the quarterly roll averaged 4.82, and half of them brought 5 or more.
| Signals in a week | Full history (781 weeks) | Last 12 months (51 weeks) |
|---|---|---|
| 0 | 45 (5.8%) | 3 (5.9%) |
| 1 to 2 | 110 (14.1%) | 6 (11.8%) |
| 3 to 5 | 365 (46.7%) | 25 (49.0%) |
| 6 or more | 261 (33.4%) | 17 (33.3%) |
| Average per week | 4.48 | 4.06 |
Hypothetical backtest. Percentages are shares of the whole weeks in each column.
In the hypothetical backtest, 2,475 of its 3,910 weekdays (63.3%) had at least one signal, a little under two weekdays in three.
Thin weeks are ordinary variation. Imagine signals landing at random times around a steady average of 4.8 a week: about one week in eight would bring only 1 or 2. The backtest matches that closely. Random timing predicts 95 such weeks among the 721 weeks outside the roll; the record has 93. At the busy end, it predicts 41 weeks of 9 or more, and the record has 41. A week with one or two signals, on its own, is no sign that anything has changed.
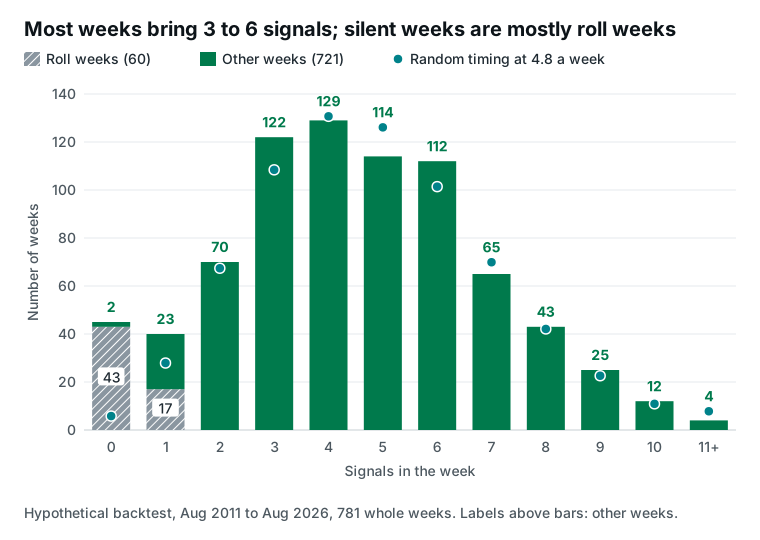
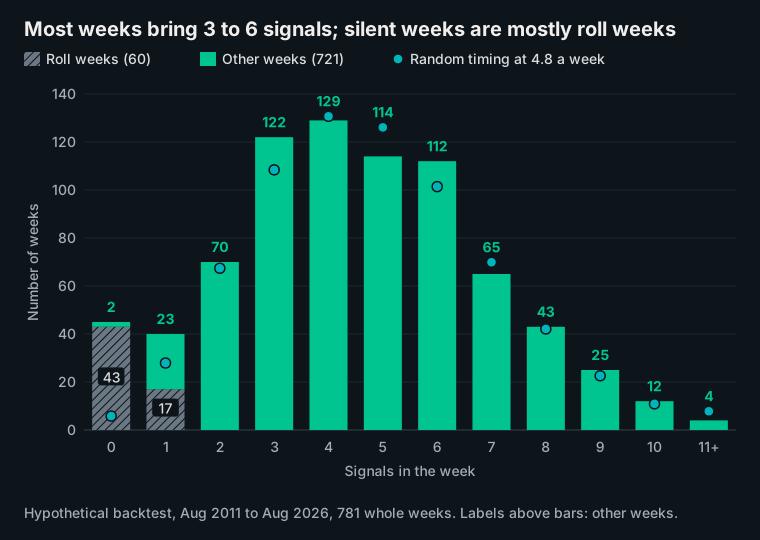
The backtest's last 12 months ran a little slower. Its weeks outside the roll averaged 4.38, against 4.82 over the full record, and none of its 51 weeks brought 9 or more, against 41 of 781 weeks (5.2%) over the full record. That dip sits inside the record's normal range: 148 of 675 runs of consecutive weeks outside the roll, each as long as that year's (21.9%), averaged 4.38 or fewer.
Has the live service matched the backtest?
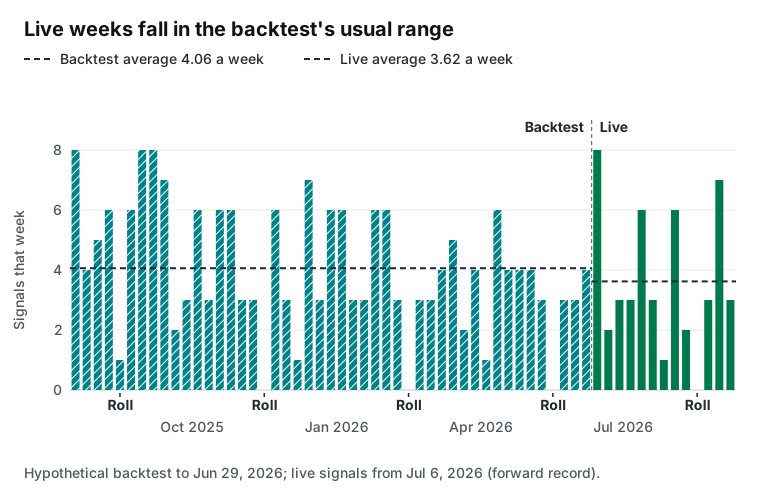
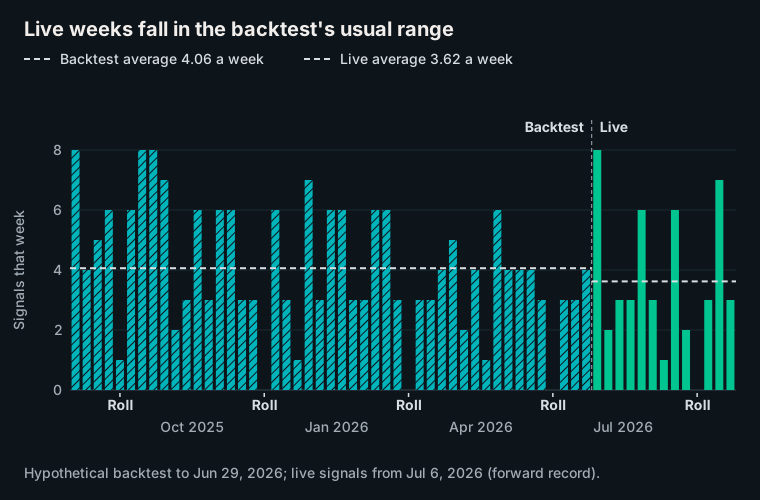
Slower so far, and within the hypothetical backtest's range. From July 6 to October 2, 2026, our NQ book sent 47 live signals in 13 full weeks, 3.62 a week, against 4.06 a week in the backtest's last 12 months.
| Signals per week | 15-year backtest | Backtest, last 12 months | Live, first 13 weeks |
|---|---|---|---|
| All weeks | 4.48 (781 weeks) | 4.06 (51 weeks) | 3.62 (13 weeks) |
| Weeks outside the roll | 4.82 (721 weeks) | 4.38 (47 weeks) | 3.92 (12 weeks) |
Backtest columns are hypothetical. Live counts come from our forward record.
Thirteen weeks is too short to call that gap real. In the backtest, 131 of 769 stretches of 13 consecutive weeks (17.0%), about one in six, averaged 3.62 or fewer. The four July weeks, which the August 5 backtest also covers, match it exactly: 8, 2, 3 and 3 signals.
None of the 12 live weeks outside the roll was silent, and 3 brought 1 or 2 signals. The one empty live week was September 7 to 11, 2026, the first live roll week. The longest live silence, 10 calendar days from September 4 to 14, spanned it. Every live signal is dated on our forward record, and our first live month compares each one with its backtest fill.
Why do some weeks have no signals?
A week with no signal is almost always the quarterly roll week. NQ futures contracts expire each March, June, September and December, and traders move to the next contract. The roll week is the Monday-to-Friday week containing the second Thursday of each of those months, and our book takes no new entries on those five days.
In the hypothetical backtest, 43 of the 60 roll weeks sent no signal; each of the other 17 shows one signal, entered at the Sunday-evening reopen before the Monday pause began and counted toward that week.
| Week type | Weeks | Weeks with no signal | Average signals per week |
|---|---|---|---|
| Roll week | 60 | 43 (72% of 60) | 0.28 |
| All other weeks | 721 | 2 (0.3% of 721) | 4.82 |
Hypothetical backtest, 2011 to 2026.
The roll week accounts for 43 of the 45 weeks with no signal in the hypothetical backtest. The other two began January 2, 2023 and April 24, 2023. It explains far fewer of the thin weeks: 17 of the 110 weeks with only 1 or 2 signals.
How long can STS go without a signal?
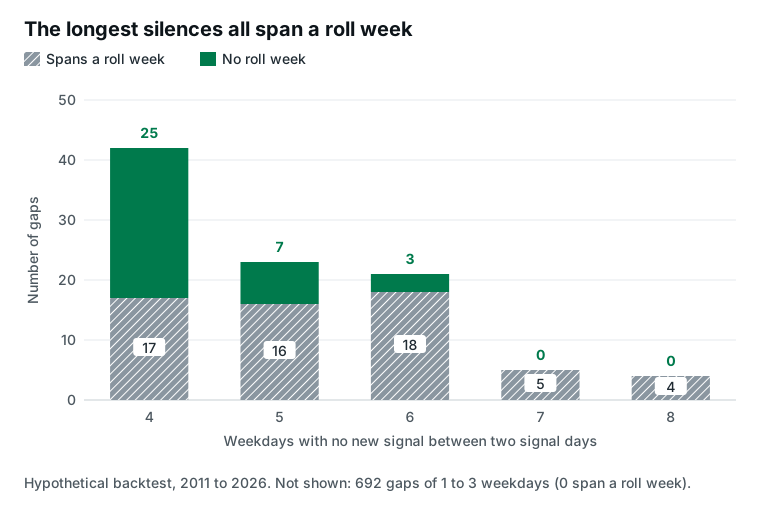
In the hypothetical backtest, the book never went more than 6 weekdays without a signal outside a roll week. The longest silence of all was 8 weekdays with no new signal (13 calendar days), and each of the four times it happened, in September 2015, June 2022, June 2023 and March 2024, it spanned a roll week.
All nine gaps of 7 or more empty weekdays include a roll week. Outside one, the longest silence was 6 weekdays, 11 calendar days, from April 21 to May 2, 2023.
Do some months and years run quieter?
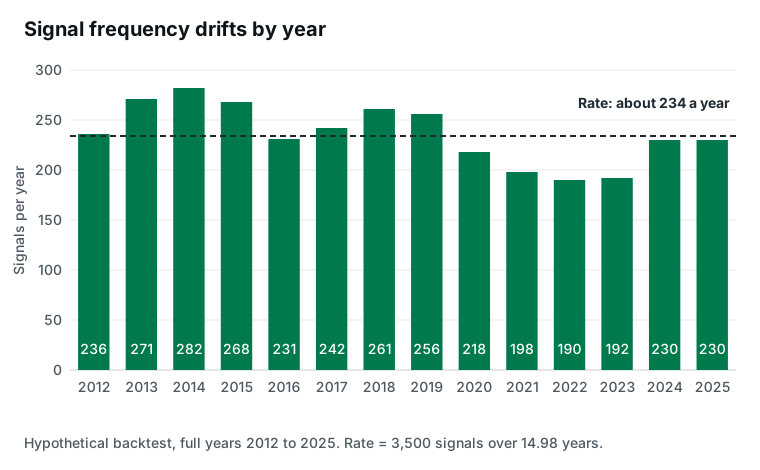
In the hypothetical backtest, some months and years ran well below average. A whole month averaged 19.4 signals, but the quietest, September 2023, brought 7, and the three quietest years ran back to back, 2021 to 2023.
| Unit | Full history | Last 12 months |
|---|---|---|
| Per week | 4.48 | 4.06 |
| Per whole month | 19.4 (range 7 to 36) | 17.3 (range 11 to 24) |
| Per year | about 234 | 215 |
Hypothetical backtest. Per year is 3,500 signals over the record's 14.98 years.
Only 5 of 179 whole months had fewer than 10 signals. The years 2021, 2022 and 2023 brought 198, 190 and 192, between 15% and 19% below the rate of about 234 a year. The busiest year was 2014, with 282.
When in the day do signals arrive?
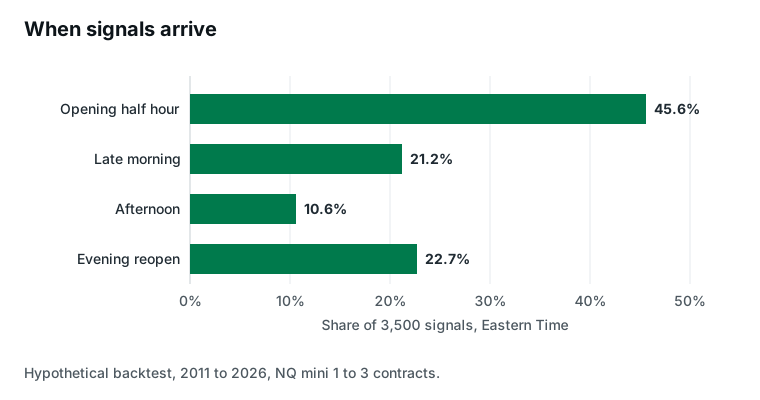
In the hypothetical backtest, the largest share, 45.6% of 3,500 signals, arrived in the opening half hour of the regular session, between the 9:30 a.m. ET open and 10 a.m. Another 22.7% came in the evening session after the 6 p.m. ET reopen.
Late morning, 10 a.m. to noon, brought 21.2%, and the afternoon, noon to the 4 p.m. close, brought 10.6%. In the hypothetical backtest, 2,688 of 2,707 daytime signals (99.3%) closed the same day, and 780 of 793 evening signals closed the next calendar day.
Opening Range Break sends the most, 36.6% of all signals, and traded in 78.0% of whole weeks.
| Strategy | Share of 3,500 signals | Weeks with a signal (of 781) | When it trades |
|---|---|---|---|
| Opening Range Break | 36.6% | 78.0% | Morning to afternoon |
| Trend | 27.0% | 57.9% | Morning |
| Overnight | 22.7% | 38.5% | Evening to next morning |
| VWAP Short | 11.7% | 39.6% | Morning to afternoon |
| Intraday Trend | 2.0% | 8.5% | Morning |
Hypothetical backtest, August 2011 to August 2026.
The book holds one position at a time, so a setup is skipped while another trade is open and signals arrive one after another. The most in one session was 5, and 838 sessions had two or more. Being reachable at those times is one of the conditions in who STS is not for.
What does this mean for you?
In the hypothetical backtest, a typical week outside the roll brought four to five signals, on a little under two weekdays in three, most often in the opening half hour or the evening session. Live weeks outside the roll have averaged 3.9 so far (12 weeks).
Once a quarter, around the March, June, September and December roll, a week with no new signal is the book working as designed. A week with only 1 or 2 signals is also ordinary: about one week in eight outside the roll.
A silence longer than 6 weekdays outside a roll week has no precedent in the 15-year backtest. If you see one, our forward record lists every signal we have sent, so you can check whether anything went out. A quiet stretch is a separate question from a losing one, which we cover in our worst losing streak.
How we measured this
- Data: our backtest of the five-strategy book dated August 5, 2026: 3,500 round trips from August 11, 2011 to August 5, 2026, NQ mini sized 1 to 3 contracts by volatility. It reproduces the published 3,500 trades, 45.5% win rate and $1,112,232 net. All backtest figures are hypothetical. The final four weeks overlap the live period that began July 6, 2026; in the backtest counts they are backtest fills.
- Live: our public forward record, fetched October 5, 2026: 47 entries from July 6 to October 2, 2026, in 13 whole Monday-to-Friday weeks, counted on the entry the same way as the backtest. Counts only; no P&L is used here.
- Counting: one signal is one round trip, an entry and its exit, counted on the entry. A Sunday evening entry counts toward Monday's session.
- Windows: weekdays are Monday to Friday; exchange holidays are not removed. Weeks are the 781 whole Monday-to-Friday weeks inside the record. Months are the 179 whole calendar months, September 2011 to July 2026. The last 12 months run August 6, 2025 to August 5, 2026. The per-year rate is 3,500 trades over 14.98 elapsed years.
- Gaps: weekdays with no new entry between two consecutive days with an entry.
- Random-timing benchmark: a Poisson distribution, the standard model for events that arrive independently at a steady average rate, set to the ordinary-week average of 4.82 and compared with the 721 weeks outside the roll week.
- Calendars: the roll week follows a fixed calendar rule in the strategy, applied the same way across the record.
- Excluded: nothing. Every trade in the record is counted.
Hypothetical Performance Disclaimer (CFTC Rule 4.41): These results are based on simulated or hypothetical performance results that have certain inherent limitations. Unlike the results shown in an actual performance record, these results do not represent actual trading. Also, because these trades have not actually been executed, these results may have under- or over-compensated for the impact, if any, of certain market factors, such as lack of liquidity. Simulated or hypothetical trading programs in general are also subject to the fact that they are designed with the benefit of hindsight. No representation is being made that any account will or is likely to achieve profits or losses similar to these being shown.
Past performance is not necessarily indicative of future results. Futures trading involves substantial risk of loss and is not suitable for all investors.
See what STS NQ futures signals are and how they reach you and our forward record, every live signal we have sent, dated and public.