Skipping trades after a loss cost $404,046 in the backtest
Skipping trades after a loss cost us money every way we tried it. We took the backtested 3,500-trade STS NQ book, replayed it in the exact order the trades happened, and made it follow five common "sit one out" rules. Every rule made less money than simply taking every signal. On the STS book, skipping the next trade after a single loss gave up $404,046, about 36% of the book's net. Even the gentlest rule we tested, sit out only after three losses in a row, still cost $19,437 and four of the book's biggest winners.
The reason is short. At a 45.5% win rate, losing streaks are ordinary math, not a warning, and our worst was 14 in a row. Our losses do not clump together more than chance, and the trade right after a loss is no worse than average. The fear rule benches you exactly when the edge is still there.
Robustness: we reshuffled the book 2,000 times, keeping losing streaks intact. Skipping after a loss lost money in 100% of them.
Whose trades are these (read this first)
These numbers come from the STS NQ book. It is five systematic NQ strategies run as one single-position portfolio, which means only one trade is ever open at a time. TradingView backtests, 2011 to 2026 (data as of August 5, 2026), one to three contracts scaled by volatility, commissions and slippage included, $1,112,232 net across 3,500 trades. The style is momentum and trend continuation, intraday plus one overnight model. Not mean reversion, not scalping.
That context matters more here than in most of our pieces. If you follow a signal service, your outcomes are literally this sequence of trades, in this order, so a skip rule on our book is close to what you would actually live through. If you trade your own discretion, the exact dollars are ours, not a law of the market. What transfers is the test: take your own closed trades, replay them in order, delete the ones a fear rule would have skipped, and check the total. The method is yours. The $404,046 is ours.
Every fear rule we tested lost money
Here is the whole result on one screen. Same book, same 3,500 trades, replayed in the order they closed. Each rule removes the trades a nervous follower would have skipped, then we compare the leftover total to the full book.
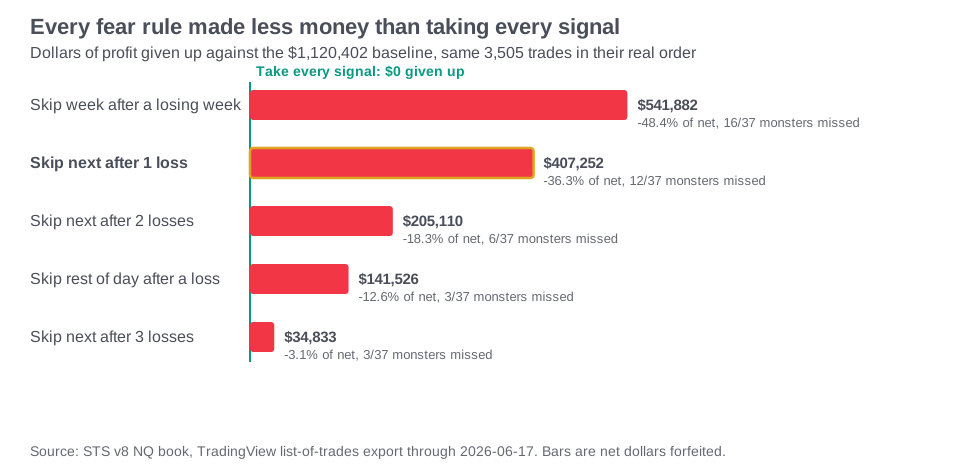
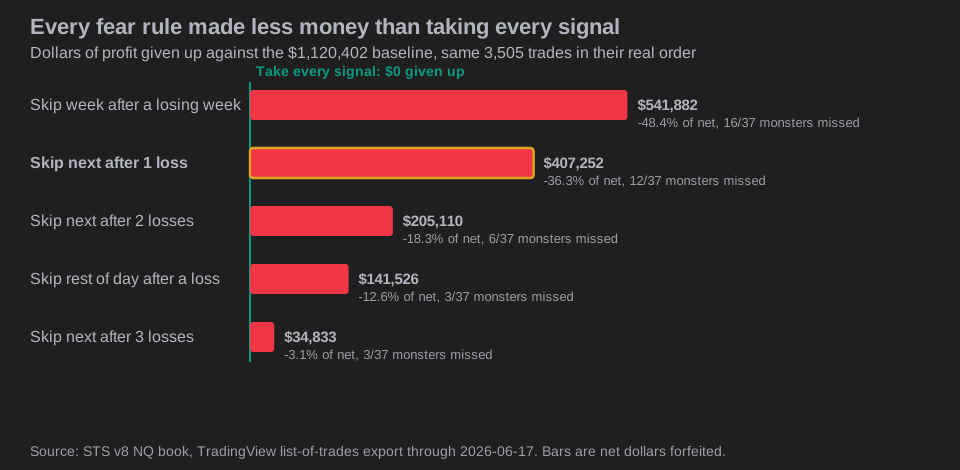
The full table, in dollars.
| Rule you follow | Trades skipped | Net after the rule | Profit given up | Share of net | Big winners missed |
|---|---|---|---|---|---|
| Skip next trade after 1 loss | 1,239 | $708,186 | -$404,046 | -36.3% | 15 of 40 |
| Skip next trade after 2 losses in a row | 553 | $898,485 | -$213,748 | -19.2% | 6 of 40 |
| Skip next trade after 3 losses in a row | 270 | $1,092,795 | -$19,437 | -1.7% | 4 of 40 |
| Skip the rest of the day after any loss | 667 | $946,868 | -$165,364 | -14.9% | 3 of 40 |
| Skip the week after a losing week | 1,510 | $582,603 | -$529,630 | -47.6% | 17 of 40 |
Read the gentlest rule first. Sit out only after three straight losses, then take the next one. That is a mild rule most disciplined traders would call reasonable. It still cost $19,437 and cut four of the 40 biggest trades out of the book. The more the rule fires, the more it costs. Skip after just one loss and you skip 1,239 trades and give up more than a third of the book.
The worst rule is the one that feels the most grown-up. Take a week off after a losing week. Of the 738 weeks in the record, 324 closed red, so this rule benched you constantly, and it kept you out through the recovery weeks that followed the bad ones. It cut the book almost in half.
Losing streaks feel like a signal but they are just math
The instinct behind every one of these rules is that a few losses in a row mean something. That the market has turned, or the system is broken, and the next trade is more likely to lose too. We tested that directly.
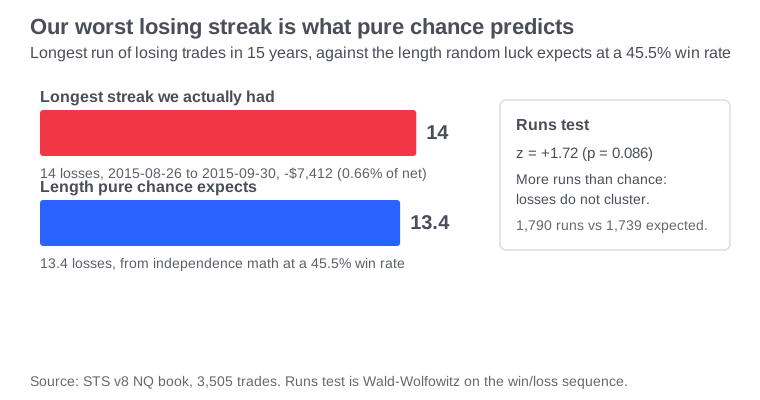
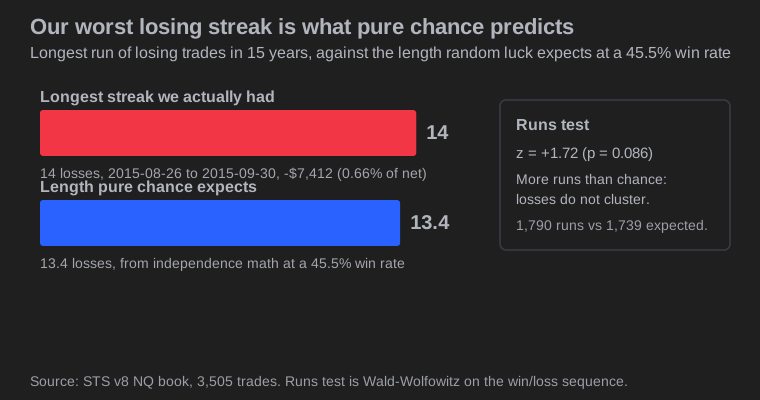
Our longest losing streak in 15 years was 14 trades in a row, from August 26 to September 30, 2015. It cost $7,412, which is 0.67% of the book's total profit. Painful to sit through, trivial to the record. And here is the part that matters: at a 45.5% win rate over 3,500 trades, the longest losing streak pure luck deals sits around 12 to 13, and a run of 14 or longer turns up in roughly one in four random orderings of the same trades. Fourteen is not a broken system. It is well inside the range chance produces.
We also ran a runs test, the standard check for whether wins and losses clump together more than chance would deal. It counts how often the sequence flips between winning and losing. Ours produced 1,786 runs against 1,737 expected under pure independence. The result, z = +1.69, leans the opposite way from the fear: the point estimate points toward alternation rather than clustering. But it is not significant (two-sided p = 0.092), so we read it as no evidence of clustering, not proof of anything. What matters is the direction: it is the opposite of the pattern the fear needs. There is no evidence our losses feed on each other. A three-in-a-row losing streak at a 45.5% win rate happens constantly, and it says nothing about the next trade.
If you want the fuller picture of why a normal future for this book includes drawdowns deeper than anything in the backtest, we worked that math in expect a worse drawdown than your backtest. Streaks like the 14-loss run are exactly the raw material of those drawdowns, and they are normal.
The trade right after a loss is the one you most want to skip, and the one you should not
This is the part that surprised us. If losing streaks were real momentum, the trade right after a loss should be worse than average. It is not.
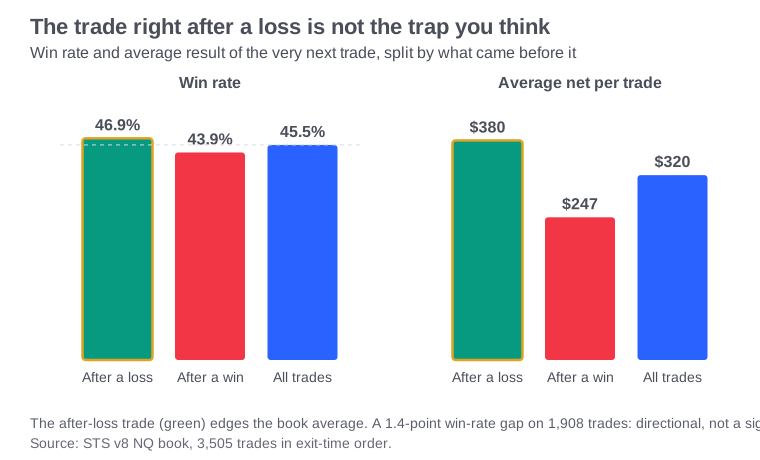
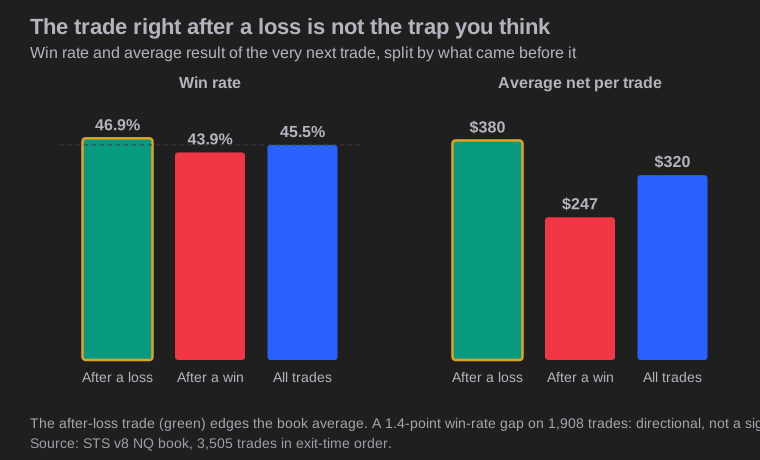
The trade right after a loss won 46.8% of the time and averaged $380. The trade after a win won 43.9% and averaged $243. The book overall is 45.5% and $318. So the exact trade the fear rule tells you to skip is, if anything, slightly better than any other trade in the book.
We are not selling this as an edge. The gap is 1.3 points of win rate on 1,908 trades, directional, not a signal you can trade on. The valid claim is the narrow one: there is no data reason to skip the trade after a loss, because it is at least as good as every other trade. The fear rule asks you to give up a normal, slightly-above-average trade to feel safer. The feeling is real. The safety is not.
Why skipping is so expensive: you cannot cut only the losers
The bills above are big for one mechanical reason. A skip rule is a blind filter. It does not know which trades are losers. It removes whatever falls after a red trade, winners and losers alike.
That would not matter much if profit were spread evenly across trades. It is not. Our book is tail-driven. The 40 monster winners, every trade worth more than $10,952 in net, are just 1.14% of the 3,500 trades, yet they carry $679,725 between them, 61.1% of the book's entire net. A blind filter that removes a chunk of trades removes a chunk of those monsters too. And because winners do not politely avoid the slots right after losses, the filter deletes them at roughly their normal rate. The skip-after-one-loss rule alone benched 15 of the 40 biggest trades in the book.
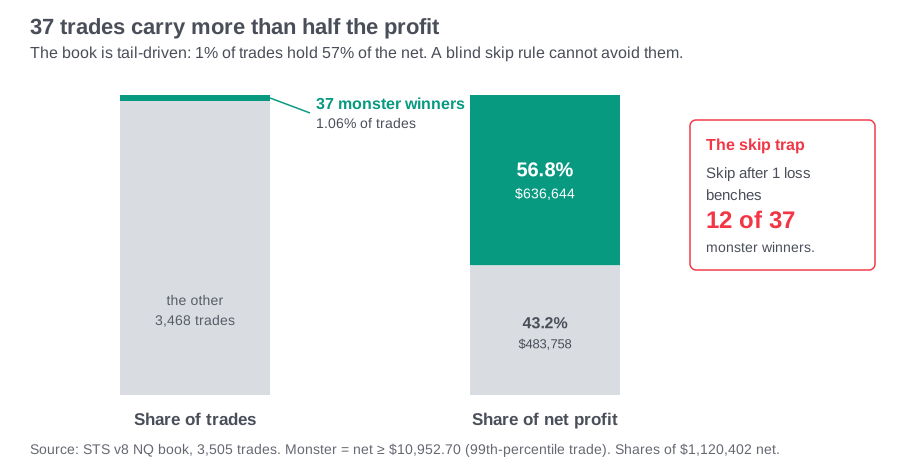
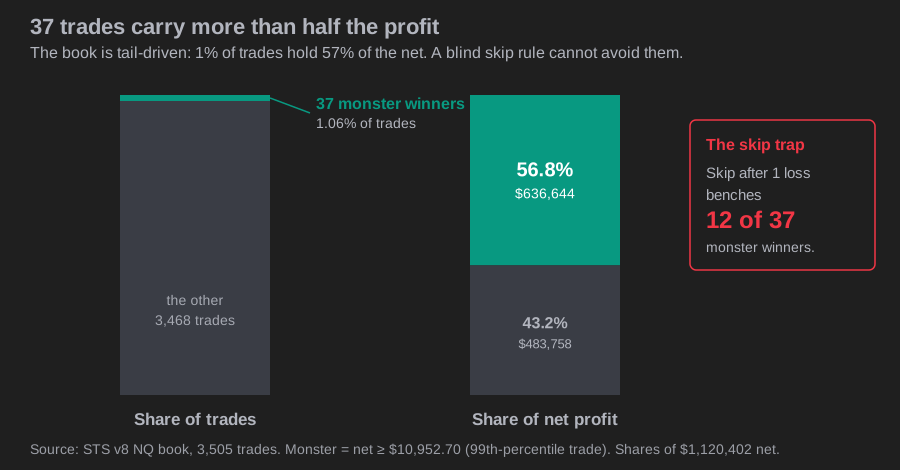
You cannot skip only the losers. Nobody can, because you do not know which is which until the trade is closed. When you skip after a loss, you are throwing away the tail that pays for everything. That handful of monster trades is why the combined book works at all, which we lay out in how our five NQ strategies fit together. Any rule that trims the sequence trims those monsters with it.
The bill is not spread evenly across the five strategies either. We tagged every one of the 1,239 skipped trades back to the sub that made it. The trend engine absorbs the most by far.
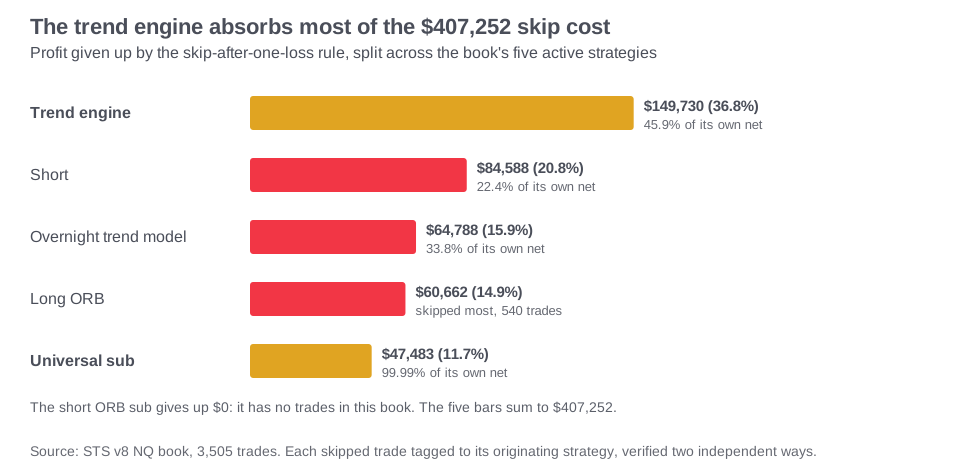
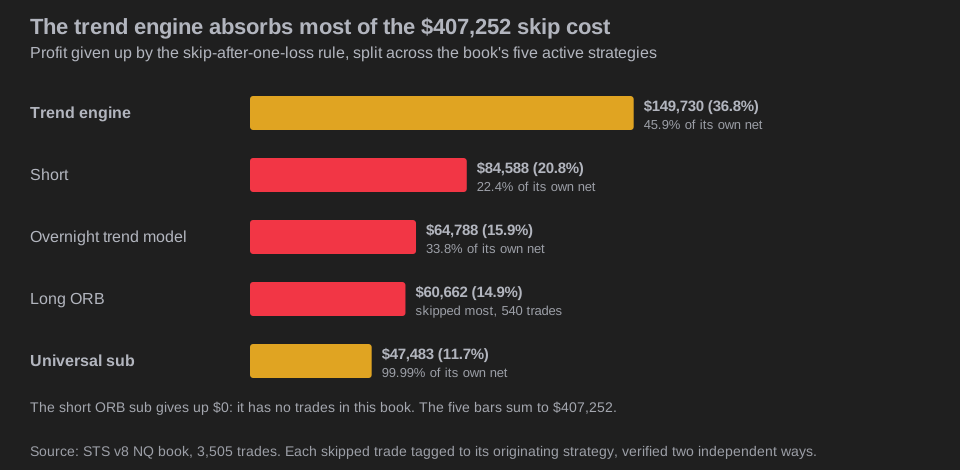
The trend engine alone eats $128,871, 31.9% of the whole bill, which is 39.3% of everything that strategy has ever made. It re-enters on momentum right after losses, so the fear rule benches it exactly when it pays. The smallest sub is worse off in relative terms. It is a 71-trade strategy worth $47,756 net, and skipping after a loss forfeits $56,880, more than the strategy ever made. Which sub bleeds the most tracks how often it trades right after losses, not its quality, and that is the point. A blind filter cannot aim. It hits whatever falls after a red trade.
The one honest limit
There is a fair objection, and we want to state it plainly rather than bury it. Our book made money overall. So of course skipping trades on a winning book loses money, because you are scaling a winning number down. On a losing book, skipping would help.
That is true, and it is the boundary of the claim. This article does not prove that skipping trades is always wrong. It proves something narrower and more useful: for a book with a real, tested, positive edge, interrupting the sequence forfeits that edge. If your system does not have a proven edge, none of this applies, and your problem is the edge, not the skipping. The way to know which case you are in is to test whether your edge is real in the first place, which is the whole point of checking if your backtest is overfit. Skip rules are a fix for a discipline problem. They are not a fix for a broken system.
How we measured this
Instrument: CME Nasdaq-100 E-mini (NQ), $100,000 nominal starting capital, no compounding, one to three contracts scaled by volatility, the same sizing the live signals deliver. Data: the TradingView list-of-trades export from our live five-strategy intraday book, first trade closing 2011-08-11, last trade closing 2026-08-05, 3,500 trades, commissions and slippage already inside the net P&L. The book-level totals (3,500 trades, $1,112,232 net, 45.5% win rate) reconcile to our published canonical stats.
Method: this is an offline what-if on real exported trades, not a fresh TradingView backtest. We sort the 3,500 trades by the time they closed, which is the order a follower experiences outcomes, then apply each rule and remove the trades it would have skipped. "Skip after K losses" means after K losing trades in a row, sit out the very next trade, then resume. "Skip the rest of the day" locks out every remaining trade that closes on a day after the first loss of that day. "Skip the week after a losing week" buckets trades into calendar weeks and skips the entire next week whenever a week closes red. A monster is a trade whose net is $10,952.70 or more, a fixed dollar cutoff carried forward from the prior export so the monster set stays comparable across refreshes, 40 trades in all. The literal top 1% by count is 35 trades ($624,004, 56.1% of net), the figure we cite elsewhere. We keep the fixed dollar threshold here so the monster set is a stable cutoff rather than a moving one. The runs test is the standard Wald-Wolfowitz test on the win/loss sequence.
We checked every number two independent ways. One script parses the raw CSV in Node with a hand-written parser; a second, fully separate script parses the same file in PowerShell with its own week-bucketing code. The two agree to the dollar on all five rules, the monster counts, the runs-test result, and the after-loss statistics. We also hand-traced the first 15 trades of the sequence to confirm the skip logic fires where it should.
We also stress-tested the flagship $404,046 against the exact order the trades happened in. That number is the cost on the one real sequence, so we reshuffled the book 2,000 times with a 20-trade moving-block resample that keeps whole losing streaks intact (mulberry32, seed 12345; the seed and the iteration count are part of the result), then re-ran the skip-after-one-loss rule on each shuffle. It lost money in 100% of the 2,000 reshuffled histories. In the 2.5% of shuffles where skipping did the least damage, it still gave up more than $216,000. The $404,046 is the historical fact and stays the headline; the reshuffle only tells us it is not a fluke of one ordering.
The limits, plainly. Because this replays the real trade list rather than re-running the engine, it does not re-simulate position availability. In our single-position book a skipped trade frees the slot, and that freed slot could have caught a trade that never appears in the record. For simple skip rules that effect is small, and it runs in one direction: it would make the true cost of skipping larger, not smaller, because freed capacity would more often catch a tail winner. An exact figure would need an in-engine TradingView backtest of each rule. The direction of the finding, every rule loses, does not depend on that refinement.
Fix a bad run with size, not with skipping
If the urge to stop after a bad run is strong, the fix is not to skip trades. It is to decide in advance, in writing, what a bad run means and what you will do about it. Pre-commitment beats willpower because the hard moment is exactly when willpower is gone.
Here is the checklist we would hand a follower who feels the pull to sit one out.
1. Write down your system's longest expected losing streak before you trade it. For a 45.5% win rate over thousands of trades, low-to-mid teens in a row is normal. Ours hit 14.
2. Decide your account can survive a drawdown deeper than any in your backtest. Size for the one you have not seen yet, not the one on the tear sheet.
3. When a streak hits, take the next trade anyway. The data says it is a normal trade, not a trap.
4. If you must react to losses, react with size, not with skipping, and only under a written rule you set in a calm moment. Never invent a rule mid-drawdown.
5. The only reason to actually stop is evidence the edge is gone, which is a months-long question about the system, not a two-loss question about today.
The through-line is that streaks are a sizing and survival problem, not a stock-picking problem. You do not beat a losing streak by guessing which trade to skip. You beat it by being sized to sit through it. The same concentration that makes skipping so expensive, a handful of monster trades carrying the record, is also the thing a funded account's consistency rule caps, which we measured in the consistency rule versus a fat-tailed book. The full record, drawdowns and all, is on our strategies page and the tear sheet, and subscribers get the same five-strategy signals measured here through the pricing page.
What we test next
The obvious next question is the one we deliberately left open: does cutting size after losses, instead of skipping, do any better than taking every trade at full size? Our gut says no, because the trade after a loss is normal, so shrinking it just shrinks a normal trade. But gut is not a number. That test needs a fresh in-engine run with variable sizing and a proper risk study, and it is on the list. When we have it, we will publish it the same way we published this, including if it proves us wrong.
Disclosure. We trade this book live and sell access to the signals, so judge the data accordingly. This article is educational and is not investment advice, a recommendation, or an offer to buy or sell any security or futures contract.
Hypothetical performance disclaimer (CFTC Rule 4.41). The results described here are based on backtested and hypothetical performance. Hypothetical performance results have many inherent limitations, some of which are described below. No representation is being made that any account will or is likely to achieve profits or losses similar to those shown. In fact, there are frequently sharp differences between hypothetical performance results and the actual results subsequently achieved by any particular trading program. One of the limitations of hypothetical performance results is that they are generally prepared with the benefit of hindsight. In addition, hypothetical trading does not involve financial risk, and no hypothetical trading record can completely account for the impact of financial risk in actual trading. For example, the ability to withstand losses or to adhere to a particular trading program in spite of trading losses are material points which can also adversely affect actual trading results. There are numerous other factors related to the markets in general or to the implementation of any specific trading program which cannot be fully accounted for in the preparation of hypothetical performance results and all of which can adversely affect actual trading results.
Past performance does not indicate future results.