NQ vs ES Futures: Which One Should You Trade?
Trade NQ if you want bigger dollar moves. It averages $2,750 of daily range per contract. ES averages $1,815. Trade ES if you want a calmer ride. And start with the micros (MNQ or MES) if you are new or under $25k.
One warning before you trade both: we measured the NQ-ES correlation at 0.93, and it gets worse when markets get wild. So trading the pair is not diversification.
That is the whole answer. Everything below is the data behind it. We measured it from our own NQ and ES price history, 2011 through May 2025. Not a spec sheet.
NQ vs ES at a glance
| ES (S&P 500) | NQ (Nasdaq-100) | |
|---|---|---|
| Point value | $50 | $20 |
| Tick size / value | 0.25 = $12.50 | 0.25 = $5.00 |
| Micro version | MES, $5 / point | MNQ, $2 / point |
| Underlying | 500 large US stocks | 100 biggest names, tech heavy |
| Typical daily range | ~$1,815 | ~$2,750 |
ES is worth more per point. NQ moves far more points. Here is how that works out in dollars, the only unit that matters.
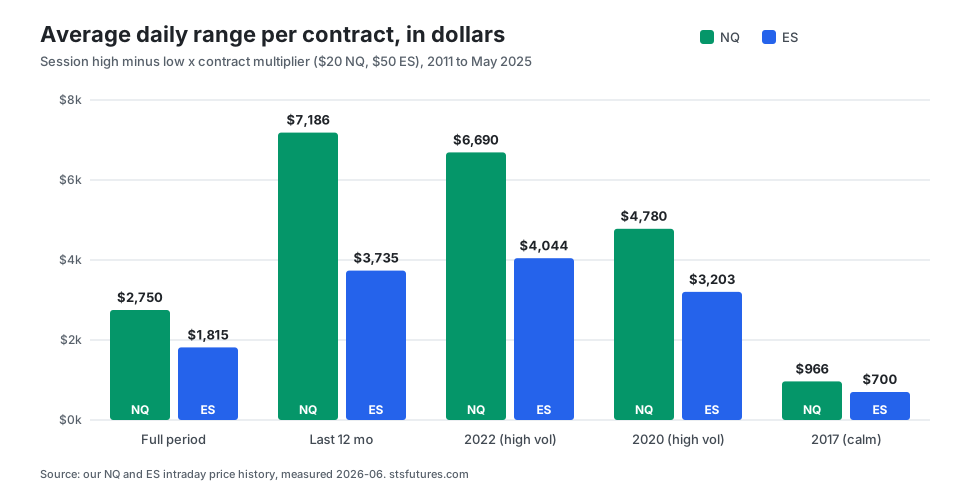
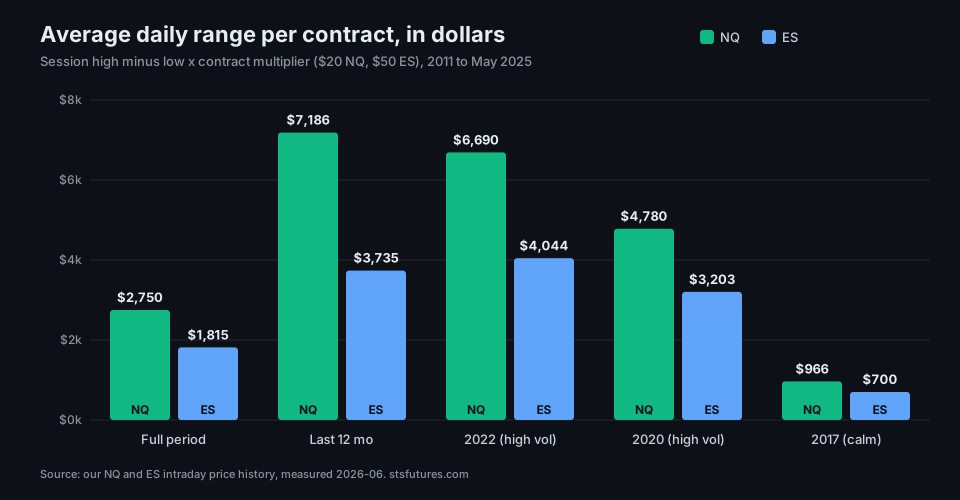
NQ vs ES daily range: 3.8x wilder in points, only 1.5x in dollars
We measured the average full-session range on both contracts, in points and in dollars.
| Period | NQ pts | NQ $/contract | ES pts | ES $/contract |
|---|---|---|---|---|
| Full (2011 to May 2025) | 137 | $2,750 | 36 | $1,815 |
| Last 12 months | 359 | $7,186 | 75 | $3,735 |
| 2022 (high vol) | 335 | $6,690 | 81 | $4,044 |
| 2020 (high vol) | 239 | $4,780 | 64 | $3,203 |
| 2017 (calm) | 48 | $966 | 14 | $700 |
Two things most comparisons miss:
- NQ is 3.8x wilder than ES in points, but only 1.5x in dollars ($2,750 vs $1,815). Why? Each ES point is worth $50. Each NQ point is worth $20. Trade the dollars, not the points.
- Range is not fixed. Calm 2017 ran NQ at $966 a day. Wild 2022 ran it at $6,690, seven times more. We break the full series out in NQ and ES average daily range. Size for today, but plan for it to triple in a stressed market.
Size from the dollar, never the point
Say you risk $500 per trade. Here is your stop on each contract:
- NQ: $500 / $20 per point = 25 points
- ES: $500 / $50 per point = 10 points
- MNQ: $500 / $2 per point = 250 points
- MES: $500 / $5 per point = 100 points
Same risk, very different stops. If you switch contracts but keep the same point stop, you just changed your risk by 2.5x without noticing. Always size from the dollar, never the point. Our point value calculator does that conversion for NQ, MNQ, ES and MES.
How wide should that stop be? We measured the worst dip on all 3,500 of our NQ trades and found fixed point stops fail. See NQ stop loss: how many points? for the data.
They move together, so size them as one position
We measured the daily-return correlation between NQ and ES at 0.927 across 4,471 sessions, and it tightens in exactly the conditions where you would want it to loosen: the two contracts protect each other least in a sell-off. Trading both at full size is not diversification.
Trading NQ and ES at full size is not diversification. It is the same bet twice, with NQ as the louder version. Size them as one combined position.
The full picture, with 15 years of rolling correlation and what happened when we ran our whole book on ES instead, is in why trading NQ and ES together is not diversification. The framework we use to frame both before the open is in how to read the NQ and ES daily bias.
When NQ actually pays (you only learn this by trading it)
A spec sheet will never tell you this. First, whose trades these are. The numbers below come from our own book of five systematic NQ strategies. We run them as one single-position portfolio in TradingView backtests, 2011 to 2026, at 1 to 3 contracts scaled by volatility. The style is momentum and trend continuation (intraday plus one overnight model), not mean reversion. So these numbers show how that kind of system experiences NQ. If you trade discretionary or mean-revert, the method of measuring your own profit by hour still works. Our exact percentages do not transfer.
Across 15 years and 3,500 of our NQ trades, 60% of all the profit came from trades entered in the 9 ET hour (the 9:30 cash open). Trades entered between 9 and noon ET made 74%. Most of what is left comes from a single overnight entry hour, 18 ET, at 18%. The rest of the day barely moves the book. The overnight system is tested on its own in our NQ overnight strategy backtest.
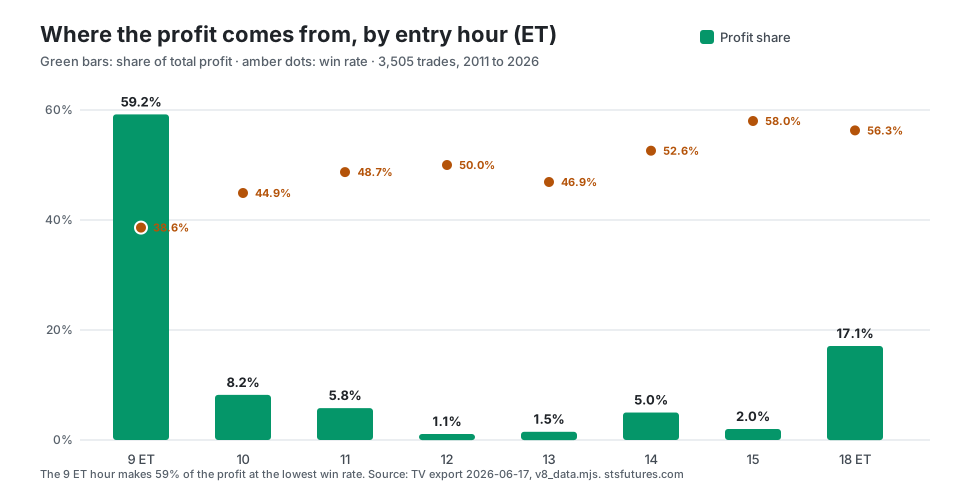
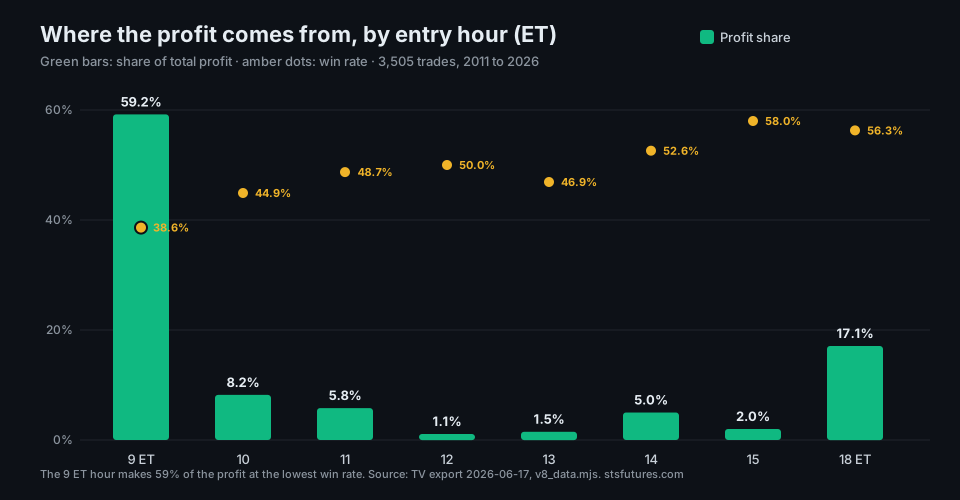
The kicker: that most profitable hour has our lowest win rate, 38%. The NQ edge is not being right often. It is catching a few big opening-range breakouts and letting them run. If you trade NQ, your day is mostly made or missed in the first 90 minutes. We built our NQ strategies around exactly that.
NQ vs ES margin: the account matters more than the margin
Intraday margin is set by your broker, and it rises with volatility. But the order holds: NQ needs more than ES, and the micros need a fraction of either. The margin to enter is not what protects you. The account behind the contract is. In a wild year NQ can swing more than $6,000 in a single day. So treat a five-figure account as the floor for one mini. Micros work on a few thousand. The account also has to outlast the slow stretches, and how long trading drawdowns last shows how long those ran in our book.
At one contract, an NQ round turn costs about $4 all in. That is a rounding error against NQ's $2,750 average daily range. Real, but not the deciding factor.
Which contract is right for you
| If this is you | Trade |
|---|---|
| Under $25k, or still learning | MNQ. Same market, a tenth of the dollar risk. |
| You want maximum movement and can stomach $5k-plus daily swings | NQ |
| You want a calmer ride and broad-market exposure | ES, or MES to start |
| You run a tested system | The contract it was built and validated on |
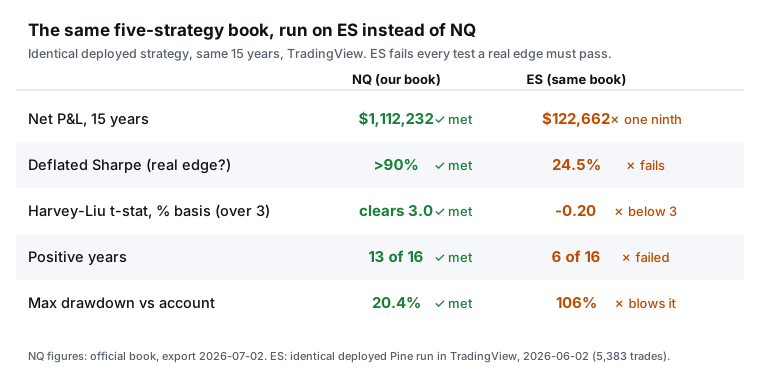
That last row is the one that matters once you trade a system: use the contract it was validated on. Ours was built on NQ, on purpose, and when we ran the same rules unchanged on ES, YM, and RTY, only NQ cleared the edge test. See the full 15-year tear sheet. And if NQ's dollar size is too big for your account, the same trade runs at one tenth on the micro, laid out in NQ vs MNQ. The NQ system itself, what it signals and the full 15-year record behind it, is on our NQ futures signals page.
How we measured this, and where the numbers stop helping
Ranges are the average session high minus low, in points. We convert points to dollars at the contract multipliers ($20 per NQ point, $50 per ES point). Correlation is computed on daily returns. The measurement window is 2011 through May 2025. The strategy figures above come from TradingView backtests at one to three contracts scaled by volatility, 2011 to 2026.
Two limits worth saying plainly. Daily range measures opportunity, not profit. No trader captures the full bar, and a wide range cuts both ways when you are on the wrong side of it. Also, the 60% profit figure describes our own strategy's trades, not NQ itself. A different system on the same contract will concentrate its profit differently, or not at all.
Trade NQ with a tested system
We run a rules-based NQ portfolio, backtested across 15 years and 3,500 trades: +1,112.2% return, 1.35 Sharpe, profitable in 13 of 16 years (the worst down year lost $4,889). These are hypothetical backtest results, data as of August 5, 2026. The full performance tear sheet is published openly. The edge leans on exactly what makes NQ NQ: the range and the opening volatility shown above. See how the book is built in our five NQ strategies, the same record under the quant edge tests on our NQ futures signals page, with the full 15-year record, or see the live signals and pricing. More on who runs the book and how the backtested record is checked is on about STS Futures.
Range and correlation figures are measured from our NQ and ES price data, 2011 through May 2025. Strategy results are backtested on the NQ mini at 1 to 3 contracts scaled by volatility, 2011 to 2026. These are hypothetical performance results (CFTC Rule 4.41); hypothetical results have inherent limitations and do not represent actual trading, and no representation is made that any account will achieve similar results. Past performance does not indicate future results. Disclosure: we trade this NQ system live and sell access to the signals; judge the data accordingly. Futures trading involves substantial risk of loss and is not suitable for all investors. This is educational content, not investment advice.