NQ vs ES, YM and RTY: We Ran Our NQ System on Every Index and Only NQ Passed
We took the exact rules that make money on NQ and ran them, unchanged, on ES, YM, and RTY. The answer is short: only NQ has a real edge. NQ passes the edge test, clearing the >90% robustness threshold. ES, YM, and RTY all score 25% or lower and fail.
Some of them still made raw money. ES booked $122,662. But raw money is not an edge. The rest of this article shows the gap between the two, and why we trade and sell NQ only.
Whose trades are these (read this first)
These numbers are from our own book. Five systematic NQ strategies run as one single-position portfolio, meaning only one trade is ever open at a time. TradingView backtests, 2011 to 2026 (data as of August 5, 2026), one to three contracts scaled by volatility, commissions and slippage included. The NQ book made $1,112,232 net over that window.
The style is momentum and trend continuation. Intraday plus one overnight model. Not mean reversion, not scalping.
That matters for this test. We did not re-tune anything for ES, YM, or RTY. We loaded the same Pine strategy, switched the chart symbol, and let it run. So this is a fair transfer test: take rules built for one market, move them to another, and see if the edge comes along. We are asking one question. Does the edge live in the rules, or does it live in NQ?
What a discretionary trader can take from this is the method, not our numbers. You can run the same check on your own system. Clone your rules onto a different market, change nothing, and look at the statistics, not the dollar total. Our exact results are ours. The test is yours to copy.
Raw money is not an edge
Here is the core result. Same system, four markets, full history, the book's own volatility-scaled sizing (one to three contracts), costs included. Max drawdown is the worst peak-to-trough loss, stated for every market as a percentage of the peak equity that market had built when the dip began, so all four rows sit on one ruler. The t-stat and Deflated Sharpe are the two edge tests, both explained below.
| Market | Net P&L | Max drawdown (% of peak equity) | t-stat | Deflated Sharpe | Verdict |
|---|---|---|---|---|---|
| NQ (Nasdaq-100) | $1,112,232 | $51,836 (4.3% of peak) | >3.0 | >90% | Real edge |
| ES (S&P 500) | $122,662 | $110,967 (106%) | -0.20 | 24.5% | Fails |
| YM (Dow) | $6,650 | $63,911 (42%) | -0.37 | 3.5% | Fails |
| RTY (Russell 2000) | $5,121 | $67,929 (52%) | -0.20 | 3.6% | Fails |
Look at ES first. It shows a $122,662 profit. At a glance that looks like the system works on the S&P too.
It does not. Two columns kill it.
The t-stat is below zero. A t-stat measures how far the average trade is from zero, scaled by how noisy the trades are. Around zero means no edge. For a real edge, researchers want a t-stat above 3. NQ clears that bar. ES is at -0.20, which is essentially zero. The small ES profit looks like money on the chart, but trade by trade it is statistically indistinguishable from a coin flip. The dollars came from a few lucky years, not a repeatable edge.
The drawdown is the second nail. ES's worst peak-to-trough loss was 106% of the peak equity it had built. The same system that lost $51,836 at its worst on NQ lost more than the entire account on ES. A real trader running it on the S&P would have been wiped out before the small profit ever showed up.
YM and RTY are even clearer. Each made only a few thousand dollars across 15 and 9 years. Their t-stats are basically zero. That is not a small edge. That is noise.
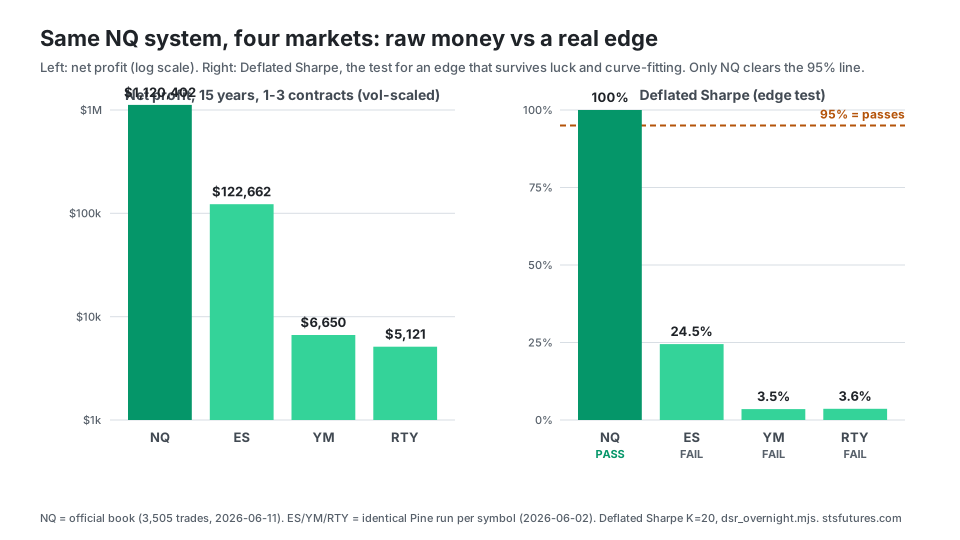
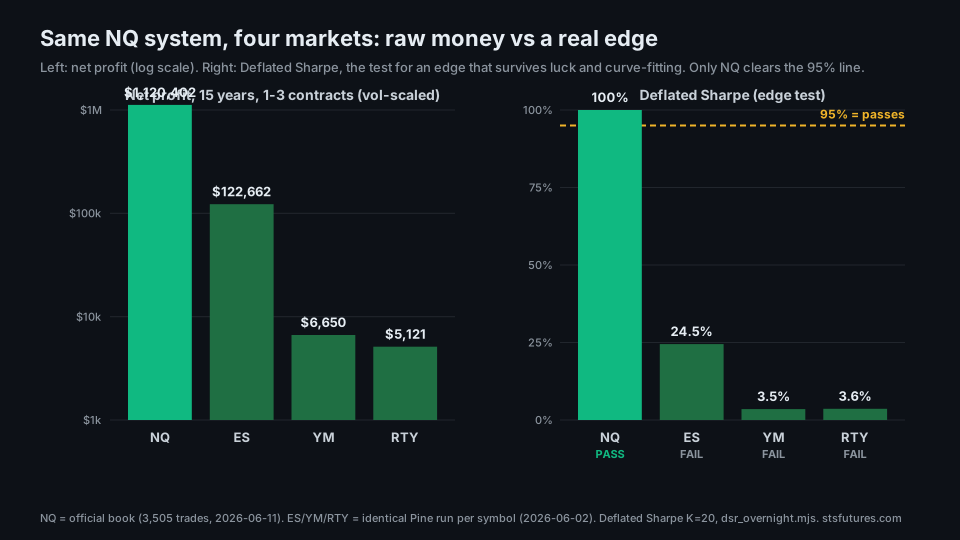
All four markets made money. Only one cleared the line that says the result is real. That second thing is the only one worth paying for.
What the Deflated Sharpe actually checks
The Deflated Sharpe is the strictest number in the table, so it is worth one plain paragraph.
A normal Sharpe ratio just asks: how good was the return for the risk taken. The problem is that if you test a strategy on enough markets, one of them will look good by luck alone. The Deflated Sharpe corrects for that. It asks: after accounting for the fact that we tried this on several markets, and for the wild outlier trades in the data, what is the chance this result is real and not luck.
A score above 90% means the edge survives that haircut. NQ clears it. ES scores 24.5%. YM and RTY score under 4%. We ran the same test, the same way, on all four. Only NQ lived through it.
This is the same test we run before any strategy goes in our book. We did not invent it for this article. It is a standard academic method (Bailey and Lopez de Prado), and it is built to catch exactly this kind of "looks profitable, is actually noise" trap.
The drawdown that came with the "money"
There is one more reason the raw P&L lies. The small profits on ES, YM, and RTY came with risk that would have ended the account.
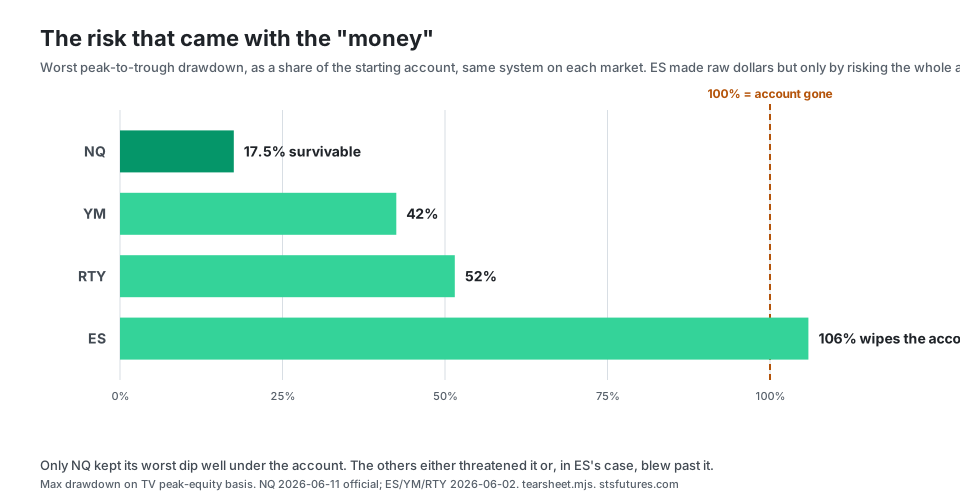
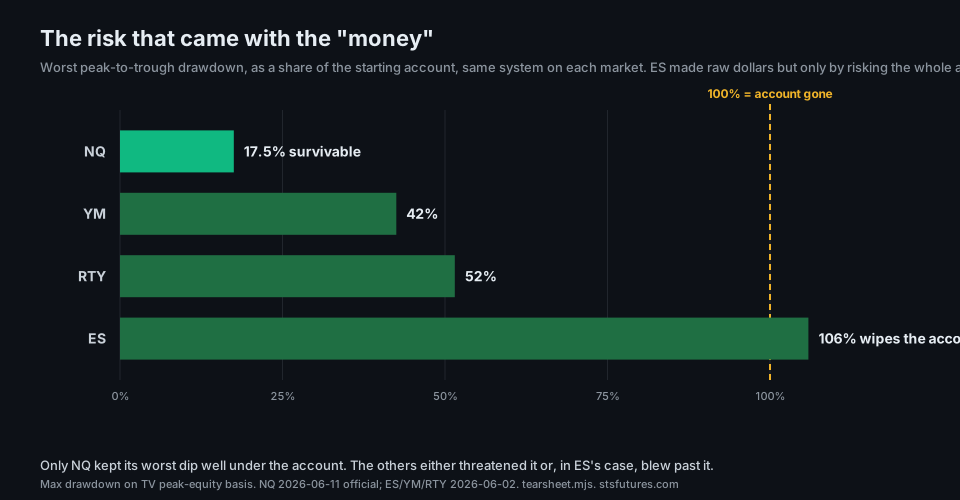
NQ's deepest dollar drawdown was $51,836, which is 4.3% of the $1,216,816 peak it fell from. Survivable. You can sit through that and keep trading. Two things to hold apart before you treat any of this as the number to plan around. First, the 20.4% on the chart below is a DIFFERENT episode measured a different way: it is the deepest PERCENTAGE dip in the record, $20,573 against a $100,721 account in 2011, and it is not the percentage of the $51,836 dollar dip. Second, $51,836 is the drawdown of the single trade order history happened to deal. Reshuffle the same trades and one ordering in twenty comes out materially deeper, which is the whole argument of expect a worse drawdown than your backtest. It does not change the comparison on this page, because every market here is measured the same way, but it does mean NQ's own figure is one point in a range, not the edge of it.
ES hit 106%. That is not a drawdown you sit through. That is a blown account. The profit ES eventually showed is a number you could never have reached, because you would have been stopped out of the game years earlier. YM at 42% and RTY at 52% are not account-enders, but they are deep holes to climb out of for almost no reward at the bottom.
So the honest read is not "the system makes a little on ES." It is "the system would have wiped the account on ES, and the leftover figure on the chart is fiction you could not have traded."
Why this is the opposite of cherry-picking
A fair question: did we just get lucky that our one chosen market is also the one that works? It is the obvious thing a skeptical trader would ask next.
We checked. We did not stop at the four index futures. We ran the same book on gold, crude oil, the euro, bitcoin, and 10-year Treasury notes too. The pattern held. A couple printed raw dollars by riding a bull market (gold, bitcoin), but every single one of them failed the edge test, the same way ES did. Treasuries were the worst. There the rules lost money on average, with a t-stat of -10.
So NQ is not one winner we picked out of a row of winners. It is the only market, out of nine we tested, where the rules produce a statistically real edge. That is the whole point of the test. A real edge usually survives at least one honest move to a new market. A curve fit does not. A curve fit is a result shaped to fit past data rather than a real edge, and it dies the moment you move it. That is what these rules did everywhere but NQ.
The edge does not live in the rules alone. It lives in how these momentum rules fit the Nasdaq's specific behavior. NQ has a bigger intraday range. It trends harder once it goes. And it pays more for the few big opening drives that carry our profit.
If you want the deeper NQ-versus-ES breakdown, we wrote a whole piece on why NQ and ES behave so differently for this system.
How we measured this
The instrument set is the four CME index futures, traded with the book's volatility-scaled sizing of one to three contracts, no compounding, $100,000 nominal starting capital. NQ is our production book on TradingView, data as of August 5, 2026 (3,500 trades). ES, YM, and RTY are the exact same five-strategy Pine, run per symbol inside TradingView over full available history, data as of June 2, 2026. NQ, ES, and YM cover about 15 years; RTY has about 9 years of TradingView history. The system stayed active on every market, taking thousands of trades each, so these are real failures, not a case of the rules sitting out.
Costs are included. The backtests carry commission and slippage on every fill, the same settings on every market.
The Deflated Sharpe uses 20 trials as the multiple-testing count, a conservative number that covers the four index futures plus the other markets we screened.
One honest limit. The strategy keys off the 9:30 ET equity open, which is the right session for the index futures but not the natural session for assets like gold or crude, so treat the non-index results as a transfer screen, not a tuned test. The NQ book used here is the single-position book every number on this site reconciles to, and it clears the 3.0 significance hurdle and passes the >90% robustness threshold.
What would change our mind: if ES, YM, or RTY cleared a t-stat of 3 and passed the >90% robustness threshold on the same unchanged rules, the "NQ-specific" claim would be wrong. They do not come close.
Judge a strategy by its statistics, not its dollar total. The same rules made money on all four markets and had a real edge on only one. A profit with a near-zero t-stat and a 100% drawdown is a story about luck and risk, not skill.
What to do with this
If you build or buy systems, do this one test before you trust any of them. Take the rules, clone them onto a market they were not built for, change nothing, and look at the t-stat and the Deflated Sharpe instead of the P&L. If it only works on the one market it was tuned on, and the dollars came with account-ending drawdowns, that is a curve fit, not an edge.
For us, this test is the reason the product is what it is. We do not sell a generic multi-market system, because we do not have one. We have a validated NQ specialist, and trying to stretch it across ES, YM, and RTY would only add drawdown and dilution, not diversification. ES in particular is 93% the same trade as NQ, so it cannot hedge it: why trading NQ and ES together is not diversification. You can see the five strategies and how they fit together on our strategies page, and the full performance record on the tear sheet.
If a single, statistically vetted NQ edge is what you want to trade alongside, that is exactly what our NQ futures signals, with the full 15-year record give you access to. One market, run the way the data says it should be run. Plans are on the pricing page.
Disclosure. We trade this book live and sell access to the signals, so judge the data accordingly. This article is educational and is not investment advice, a recommendation, or an offer to buy or sell any security or futures contract.
Hypothetical performance disclaimer (CFTC Rule 4.41). The results described here are based on backtested and hypothetical performance. Hypothetical performance results have many inherent limitations, some of which are described below. No representation is being made that any account will or is likely to achieve profits or losses similar to those shown. In fact, there are frequently sharp differences between hypothetical performance results and the actual results subsequently achieved by any particular trading program. One of the limitations of hypothetical performance results is that they are generally prepared with the benefit of hindsight. In addition, hypothetical trading does not involve financial risk, and no hypothetical trading record can completely account for the impact of financial risk in actual trading. For example, the ability to withstand losses or to adhere to a particular trading program in spite of trading losses are material points which can also adversely affect actual trading results. There are numerous other factors related to the markets in general or to the implementation of any specific trading program which cannot be fully accounted for in the preparation of hypothetical performance results and all of which can adversely affect actual trading results.
Past performance does not indicate future results.