Does an NQ overnight trading strategy actually have an edge? A 14-year backtest
Yes, but as a diversifier, not a lone edge. Our overnight NQ sub made $194,333 over 796 trades in 14 years at the book's highest win rate, 56.3%, with a Sharpe of 1.06. The one number that earns it a slot is its 0.06 correlation to our day-session strategies. It barely overlaps with anything else we trade, so it adds return without adding the same risk twice.
The folklore is that the S&P and Nasdaq drift up overnight while the day session churns. Some of that is real. But "buy the close, sell the open" is not what we run, and a naive drift trade would have handed most of its gains back in fills and bad nights. What we run is a momentum rule that only holds overnight when the prior session earned it. We looked at which day-session hours actually carry our edge in the best time to trade NQ futures; this is the after-hours companion to that.
The profit is spread across hundreds of trades, not a few lucky nights
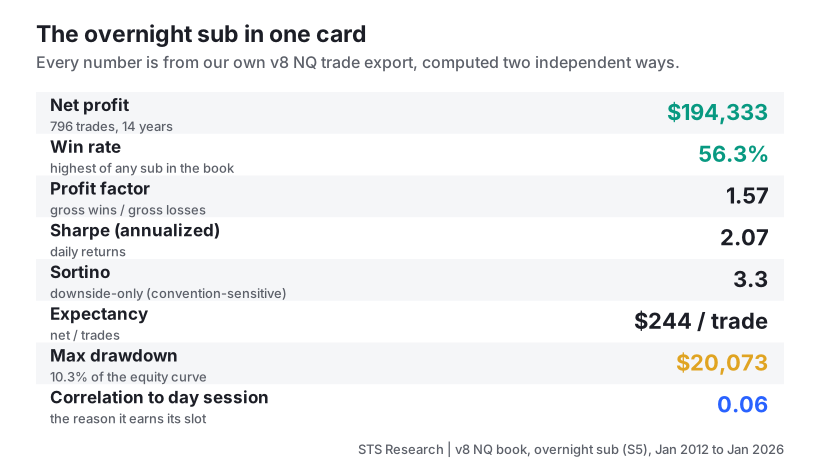
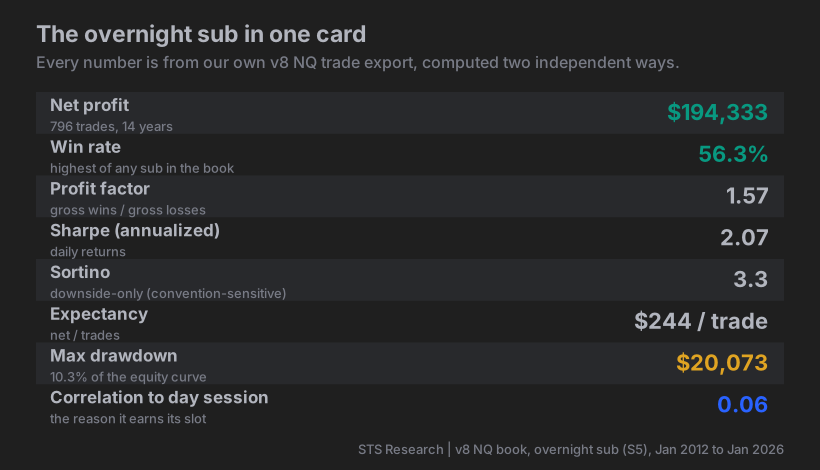
Here is the whole argument in one table. Every number is from our own trade export, computed two independent ways.
| Metric | Overnight sub (S5) | What it means |
|---|---|---|
| Net profit | $194,333 | Sum of net P&L, 796 trades |
| Trades | 796 | Over 14 years (Jan 2012 to Jan 2026) |
| Win rate | 56.3% | Highest of any sub in our book |
| Profit factor | 1.57 | Gross wins / gross losses |
| Sharpe (annualized) | 1.06 | All weekdays, non-trading days zero-filled, running-equity denominator, x sqrt(252). Same basis as the book's 1.35, so the two are comparable |
| Sortino | 1.76 | Downside-only, same basis as the Sharpe above |
| Expectancy | $244 / trade | Net / trades |
| Skew (% returns) | -0.24 | On volatility-normalized returns (dollar basis differs, see below) |
| Excess kurtosis (% returns) | -0.2 | Below normal on the % basis (dollar basis differs, see below) |
| Max drawdown | $20,073 | Worst peak-to-trough on the equity curve (10.3% of the curve) |
| Correlation to day session | 0.06 | Near zero, the reason it earns its slot |
The skew and kurtosis numbers deserve a careful read, because they depend on how you measure a trade. On volatility-normalized returns (each trade as a percent of the capital it risked), skew is -0.24 and excess kurtosis is -0.2, both below a normal distribution: no outlier trade dominates once you account for position size. On raw dollar P&L the picture flips, because we scale 1 to 3 contracts by volatility, so the biggest dollar wins land in the most volatile stretches. On that dollar basis skew is +0.72 and excess kurtosis is +8.0, a fatter right tail. Both are true; they answer different questions. The percent basis tells you the per-unit-risk edge is broad-based; the dollar basis tells you your realized P&L will have some large-position outliers. We flag both rather than quote only the flattering one.
Average win is $1,200, average loss is $987, a payoff of 1.22. Combine that with a 56.3% win rate and the math works without needing a home run. It wins a bit more than half the time and wins slightly bigger than it loses.
Whose trades are these
Our book is 6 systematic NQ strategies run as one single-position account, backtested on TradingView from 2011 to 2026 at 1 to 3 volatility-scaled contracts. S5 is the one overnight sub. It enters in the direction of the prior session's trend, holds through the Globex overnight session, and exits on a morning or end-of-day rule.
It is a momentum strategy, not mean reversion, and not scalping. Everything below is conditional on that style. "Overnight NQ has an edge" is our shorthand for "this specific momentum-into-Globex rule had an edge on NQ." A different overnight rule could do the opposite. We are not claiming the overnight session is free money.
The 0.06 correlation is the actual point
A strategy does not need to be the best one in the book to belong in it. It needs to make money doing something the others do not. That is what buys you a smoother equity curve.
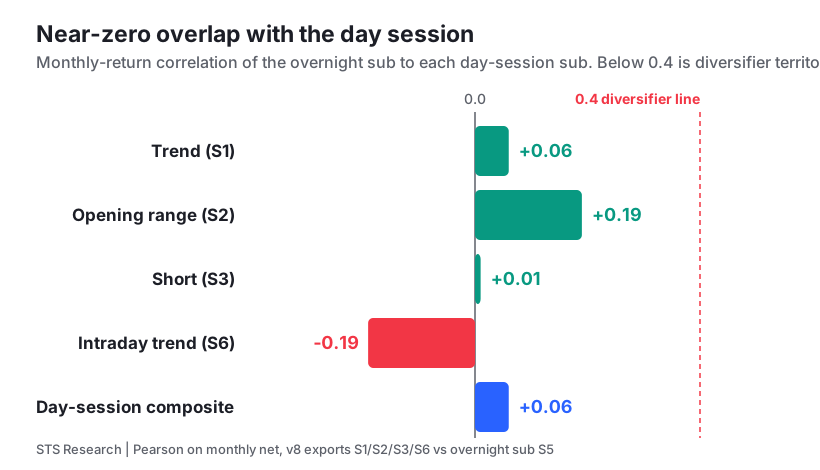
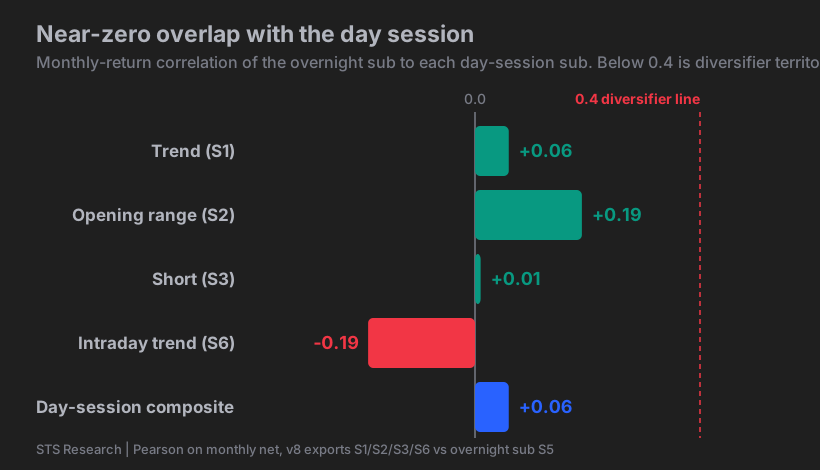
We measured the monthly returns of S5 against the combined monthly returns of the four day-session subs (Trend, opening-range, Short, and a small universal sub). The Pearson correlation is 0.06. Per sub it ranges from -0.19 to +0.19. In plain terms: when the day-session book has a bad month, the overnight sub is close to a coin flip on whether it also has a bad month. That is exactly what a diversifier should look like.
One honest note on how we measured it. We correlate the overnight sub to the rest of the book, not to the full book. Measured against the full six-sub book, the number is 0.42, but that is inflated because the overnight sub is inside that book and partly correlates with itself. Stripping it out and comparing it only to the four day-session subs it is meant to diversify gives the clean 0.06.
This is why we keep it even though, as you will see, it does not clear our solo-edge bar. Diversification is a real, measurable thing, not a slogan. A 0.06-correlation stream that makes $194K over 14 years lowers the whole book's drawdown more than a higher-returning stream that moves in lockstep with what we already own. We wrote about that math in why a book of low-correlation systems beats one.
The honest limit: it does not clear our solo-edge bar
Standalone, the overnight sub's per-trade t-stat is 2.93 on volatility-normalized returns (naive-IID, assuming independent trades). Our own anti-overfit rule says a fresh standalone edge needs a t-stat above 3 before we would trust it on its own. On this per-unit-risk basis, S5 does not clear it.
We use the percent basis on purpose, and we will show our work. On raw dollar P&L the same 796 trades give a t-stat of 3.63, which does clear 3. The gap is entirely position sizing: dollar t rewards the strategy for having been larger in its best regimes, which is a real part of the realized track record but a weaker test of whether the underlying edge is genuine. The percent basis strips sizing out and asks the harder question, is the per-trade edge itself significant, and there the answer is a hair light. We hold ourselves to the harder test. And even 2.93 is optimistic, because naive-IID treats every night as independent; overnight momentum trades cluster in regimes, so the effective number of independent bets is below 796 and the true standalone t is somewhat lower still.
So we do not treat it as a bulletproof solo strategy. It stays in the book for one reason: it is uncorrelated, and the diversification math earns its slot. Take it out on its own and pitch it as a standalone system, and we would tell you the per-unit-risk t-stat is a hair light. Inside a book of six low-correlation streams, that same sub pulls its weight. Stacking marginal, barely-correlated edges like this one is the method we set out in how to build a profitable NQ strategy.
There is a second limit worth stating plainly. These figures inherit TradingView's fill model. The robustness checks below (Monte Carlo, tick jitter) are what-ifs applied to those backtested trades, not fresh in-engine backtests. They stress the result; they do not re-run the strategy from scratch.
What the robustness checks show
We ran three stress tests on the 796-trade stream. All are seeded, so they reproduce exactly.
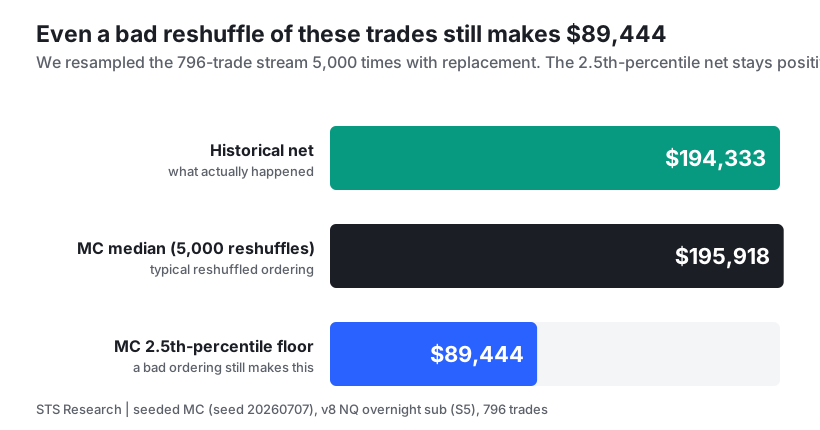
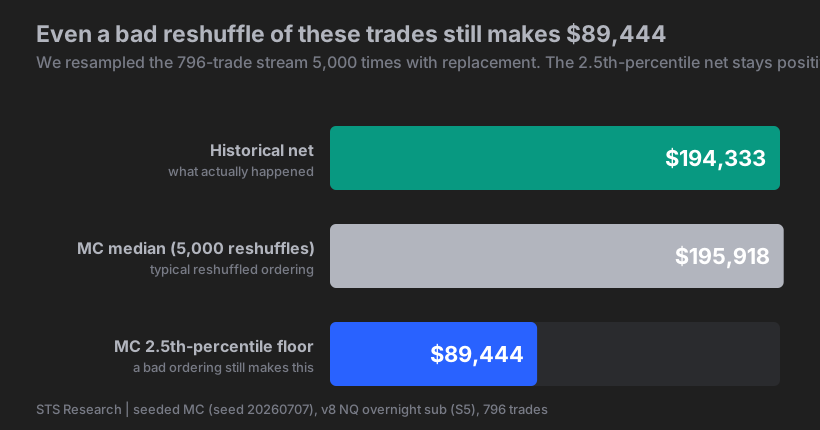
Monte Carlo (5,000 reshuffles). We resampled the trade sequence with replacement 5,000 times. The 2.5th-percentile net stays at $89,444, still strongly positive. Even a bad ordering of these trades makes money. Median simulated max drawdown is about $23,000; the 97.5th percentile is about $46,000, which is the drawdown you should be mentally prepared for even though history only served up $20,073.
Tick jitter (±1 to 3 ticks). We nudged every entry and exit fill by up to 3 ticks in the wrong direction. Net barely moves and the t-stat median holds at 2.93, with the 2.5th-percentile t-stat staying at or above 2.83 even at the worst setting. The edge is not living on a single tick of favorable fill.
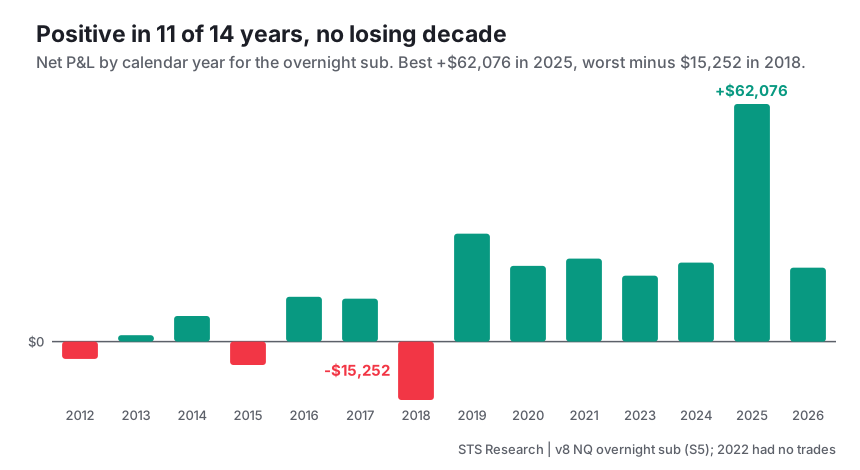
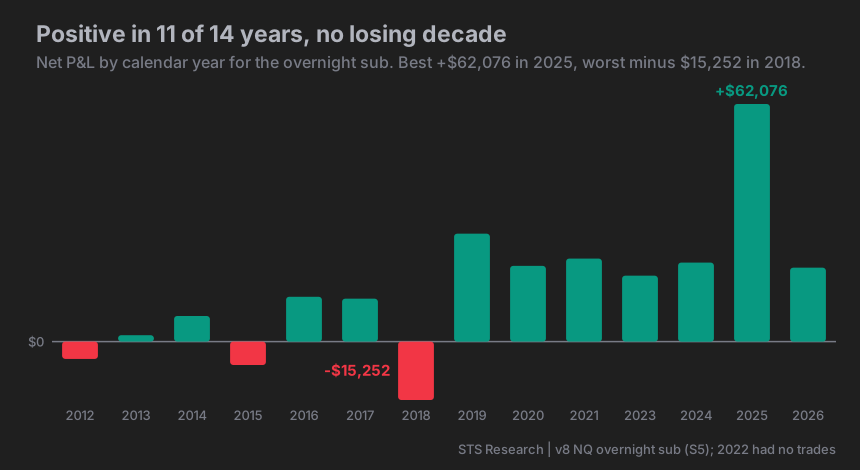
Rolling stability. Profit factor stays above 1 in 11 of 12 rolling four-year windows (the one miss is 0.97, essentially break-even). These windows overlap by three years each, so treat this as a smoothness read, not 12 independent trials. By calendar year, which does not overlap, it is positive in 11 of 14, best year +$62,076 (2025), worst -$15,252 (2018). It has losing years. It does not have a losing decade.
Methodology
- Instrument: NQ (E-mini Nasdaq-100 futures), CME, continuous contract, contract-roll rebased.
- Data and window: the overnight sub's own trades run 23 Jan 2012 to 29 Jan 2026, 14.0 calendar years, 796 trades. The full 6-sub book spans 2011 to 2026, roughly 15 years, which is where the "15-year" framing comes from. The overnight sub itself is 14 years; we lead with the honest count.
- Costs: commissions and slippage are baked into the net P&L per trade.
- Sizing: 1 to 3 contracts, scaled by volatility, single position across the whole book.
- Basis for higher-moment stats: skew, kurtosis, and the solo t-stat are computed on volatility-normalized (percent) returns, which strip out position sizing. On raw dollar P&L the same trades show a fatter right tail (skew +0.72, excess kurtosis +8.0) and a higher t-stat (3.63); both are reported in the body. We lead with the percent basis because it is the harder test of the underlying edge.
- Sharpe and Sortino basis: both are on the same basis as the book's 1.35 / 2.60, namely daily returns over every weekday in the sub's span with non-trading days zero-filled, a running-equity denominator, annualised by sqrt(252). A narrower basis that counts only the 791 days this sub actually closed a trade is not wrong arithmetic, but it charges the ratio for 791 days of risk and annualises it over 252, which flatters a sub that trades on a fifth of the calendar far more than it flatters the book. On one ruler the sub scores 1.06 against the book's 1.35, which is the ordinary result of diversification and the reason the sub is run inside a book rather than alone.
- Drawdown percent: the $20,073 max drawdown is 10.3% of the sub's own equity curve. Any larger percent you see quoted elsewhere is normalized to allocated account capital, not to the curve; we cite the dollar figure and the curve percent to avoid ambiguity.
- What would falsify this: if the correlation to the day session were actually high (say above 0.4), the diversification claim collapses and we should drop it. If the t-stat were below 2 on both bases, we would not run it at all. If the per-unit-risk profit came from a few outlier trades (high positive percent-basis skew and kurtosis), the "broad-based" claim would be false. None of those held.
You can reproduce the tear sheet from our export with two scripts, one built on our standard tear-sheet tool and one an independent re-parse. If you want to see how we audit any track record for these traps, we wrote it up in how to audit a trading track record.
Copy-paste: the four checks before you trust any overnight backtest
Before you believe any "overnight NQ makes money" chart, run these four on the trade list:
1. Correlation to your day trades      -> if > 0.4, it is not really a diversifier
2. Skew and excess kurtosis            -> compute on BOTH % and dollar P&L; if the % basis is fat
                                          right-tailed, a few risk-adjusted trades carry it
3. Per-trade t-stat (% returns)         -> below ~2, it is noise; 2 to 3, diversifier only; >3, solo edge
4. Rolling 4-year profit factor         -> if it is not > 1 in most windows, it is regime luck
Our overnight sub passes 1, 2, and 4 cleanly and lands in the "diversifier only" band on 3. That is an honest place for it to sit.
Where this goes next
The interesting question is not whether the overnight sub is a solo edge. We already know it is not. The question is how much more book-level drawdown we can shave by pairing this 0.06-correlation stream with a second uncorrelated one. That is the next test: find or build another low-correlation sleeve and measure the marginal drawdown reduction, the same way we measured this one. See the full set of live streams on our strategies, or the current book tear sheet on the tearsheet. If you want the signals themselves, that is what access is for.
Conflict disclosure: We trade this book live and sell access to the signals. Judge the data on its merits and reproduce it yourself; we have every incentive to show it in a good light, which is exactly why every number here traces to a raw trade export and is computed two independent ways.
CFTC Rule 4.41: Hypothetical or simulated performance results have certain limitations. Unlike an actual performance record, simulated results do not represent actual trading. Also, since the trades have not actually been executed, the results may have under- or over-compensated for the impact, if any, of certain market factors, such as lack of liquidity. Simulated trading programs in general are also subject to the fact that they are designed with the benefit of hindsight. No representation is being made that any account will or is likely to achieve profit or losses similar to those shown.
Past performance is not necessarily indicative of future results. Futures trading involves substantial risk of loss and is not suitable for every investor.