Prop combine reset math: the true expected cost of getting funded
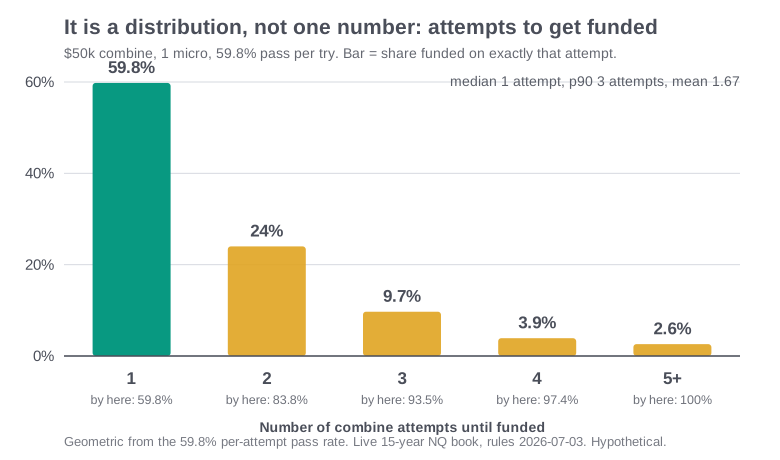
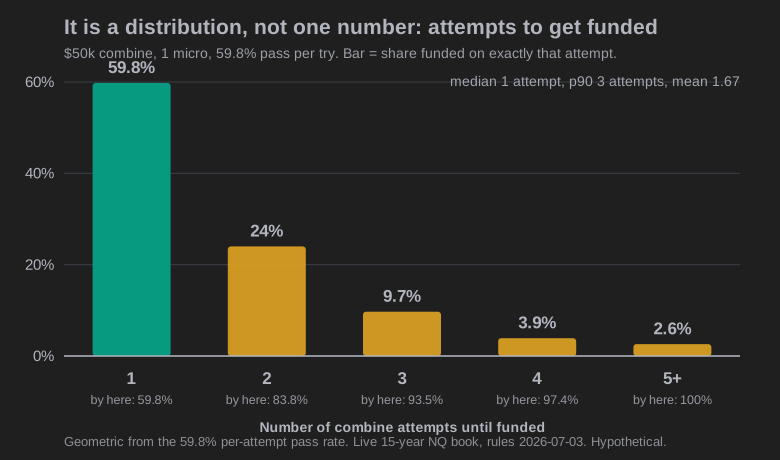
Getting funded costs a median of about $443 all-in, and almost no cost calculator tells you that, because the real bill is not one combine fee. It is every failed attempt added up. We ran the STS backtested 15-year NQ book through TopStep's $50k combine at one micro per signal. It passes about 55% of the time per attempt (44.2% to 66.5% across resampled histories), so the median trader is funded on the first or second try and pays about $443, counting the monthly fee on every attempt plus the one $149 activation. The unlucky one in ten pays about $786.
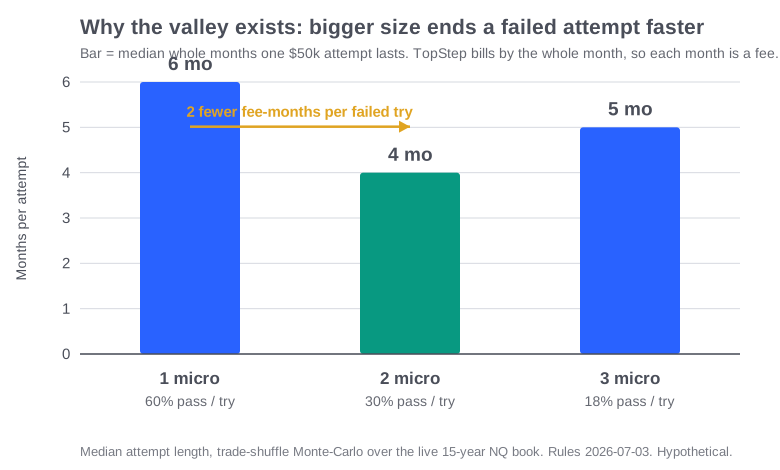
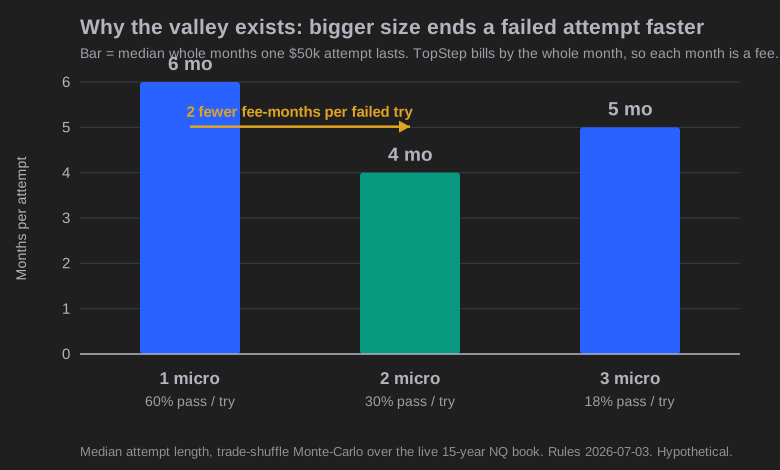
Now the part that catches people. Sizing up to two micros cuts the per-attempt pass rate to about 28%, half as often, yet it lowers median total spend to about $345. Failed attempts end faster and burn fewer whole-month fees. What you pay is driven as much by how long each attempt lasts as by how often you pass.
Every prop-firm cost calculator we have seen stops at one pass rate and one number. That hides the real story, which is a distribution. Below is the full spread of attempts and dollars, resets included.
Whose trades are these (read this before using our numbers)
Everything below runs on the STS NQ book: five systematic NQ strategies traded as one single-position portfolio. TradingView backtests, 2011 to 2026 (data as of August 5, 2026), one to three contracts scaled by volatility, commissions and slippage included, $1,112,232 net across 3,500 trades. The style is momentum and trend continuation, intraday plus one overnight model. We modeled the combine at one to three micros per signal, since that is the size a real trader would run on a $50k account.
That style shapes the odds. A momentum book has long quiet stretches between big winners, so it often dips before it climbs to the target. Your strategy has its own pass rate and its own attempt length. What transfers to any trader, including a discretionary one, is the method: measure your own per-attempt pass rate and your own median attempt length, then run them through the reset formula below. Our exact probabilities are our system on these rules, not a law of nature.
The reset math grid: nine ways to get funded, priced out
Here is the whole argument in one table. For each account size and each micro ladder, we ran 20,000 shuffled orderings of the real trade list, ended every attempt at the first pass or blow, then priced 50,000 full funding paths including every failed retry.
| Account | Size | P(pass) / attempt | E[attempts] | Median attempts | p90 attempts | Median all-in | Mean all-in | p90 all-in |
|---|---|---|---|---|---|---|---|---|
| $50k | 1 micro | 55.4% | 1.81 | 1 | 3 | $443 | $493 | $786 |
| $50k | 2 micro | 28.0% | 3.57 | 3 | 8 | $345 | $418 | $688 |
| $50k | 3 micro | 16.1% | 6.22 | 4 | 14 | $394 | $488 | $884 |
| $100k | 1 micro | 76.4% | 1.31 | 1 | 2 | $1,139 | $1,318 | $2,129 |
| $100k | 2 micro | 39.7% | 2.52 | 2 | 5 | $743 | $890 | $1,535 |
| $100k | 3 micro | 26.0% | 3.84 | 3 | 8 | $644 | $802 | $1,436 |
| $150k | 1 micro | 91.9% | 1.09 | 1 | 1 | $3,333 | $3,507 | $5,522 |
| $150k | 2 micro | 60.7% | 1.65 | 1 | 3 | $1,741 | $2,039 | $3,532 |
| $150k | 3 micro | 39.7% | 2.52 | 2 | 5 | $1,343 | $1,638 | $2,935 |
The single cheapest median path in the whole grid is the $50k account at two micros, $345 all-in. The $150k account has the best odds by far, 92% on the first try, but it also has the biggest bill, a $3,333 median. Better odds do not mean cheaper.
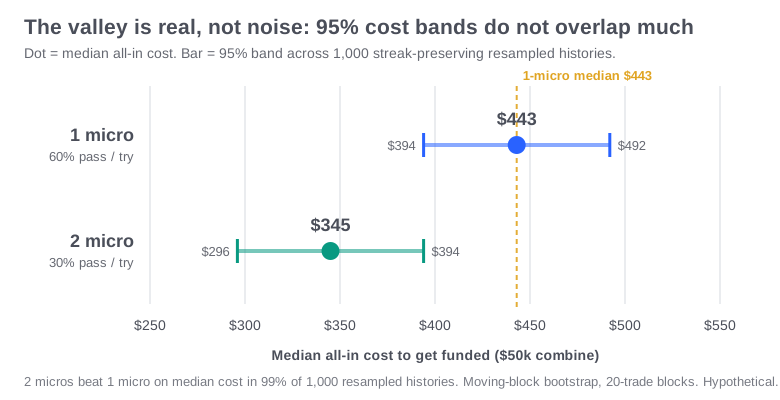
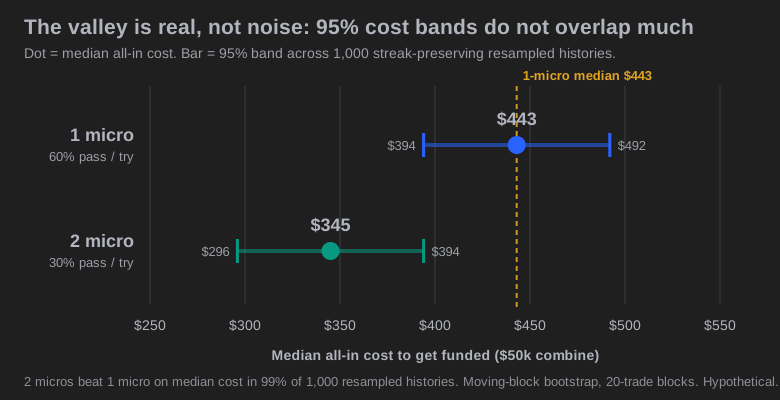
The two $50k cells carry a 95% band from the same resampling: $443 sits in [$394, $541], and the cheapest cell, $345, sits in [$296, $394]. We have not re-run the bootstrap across the $100k and $150k cells on this basis, so those rows carry no band. Read them as point estimates and treat the big-account figures as approximate.
Sizing up passes less often and still costs less
Look down the $50k rows. One micro passes 55% of the time and costs $443. Two micros pass only 28% of the time, half as often, yet the median cost drops to $345. Three micros pass just 16% of the time and the cost creeps back up to $394.
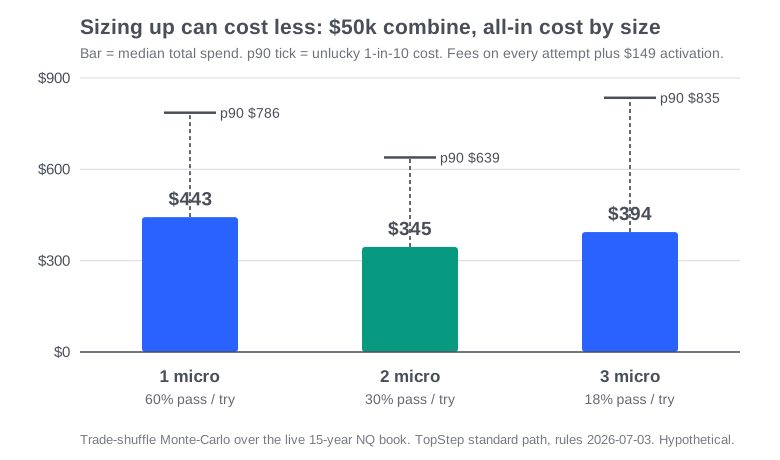
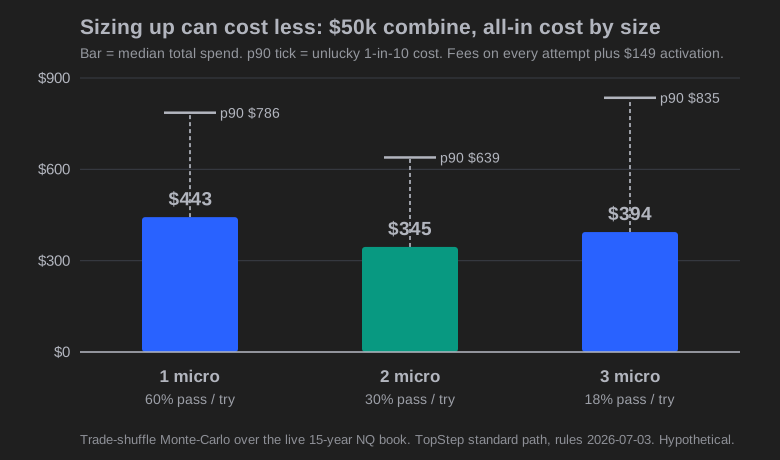
The reason is fee mechanics, not skill. TopStep bills by the whole month. A bigger position hits the trailing floor faster, so a failed attempt is shorter and skips the next month's charge. At two micros the median path to funded burns four whole-month fees across three attempts, against six fee-months across one attempt at a single micro. A fee-month is not an attempt: TopStep bills the calendar, so one slow attempt can bill many months. Each failed try is cheaper, and even though you take more of them, the total lands lower. Those month figures convert trades-to-pass at our recent trading cadence, so a slower cadence would lengthen every attempt and narrow the gap.
This is not a fluke of one trade order. We re-ran the whole thing on 1,000 resampled versions of our 15-year book, each one rebuilt in blocks that keep the losing streaks intact. Two micros came in cheaper than one micro in 98.1% of them. The two-micro 95% cost band, $296 to $394, sits at or below the one-micro median of $443. The ordering held in 981 of 1,000 resamples, though it leans on TopStep's whole-month billing, and prorated fees would shrink or erase it.
The effect does not run forever. Push to three micros and the loss tail gets fat. You stack so many failed attempts that the extra fees outweigh the speed. The cheap spot is a valley, not a slope, and for our $50k book it sits at two micros.
This is a cost result, not a "size up" recommendation. Bigger size means more blown attempts and more resets, which is bruising to trade even when the fee bill is lower. A trailing floor punishes size because it measures the depth of your dips, and those dips scale directly with contract count. That distribution is in what a $25k account can actually hold.
The small account is the cheapest way in
Which account should you buy? On raw pass odds, the $150k wins in a walk: 92% on the first attempt versus 55% for the $50k. But odds are not the bill.
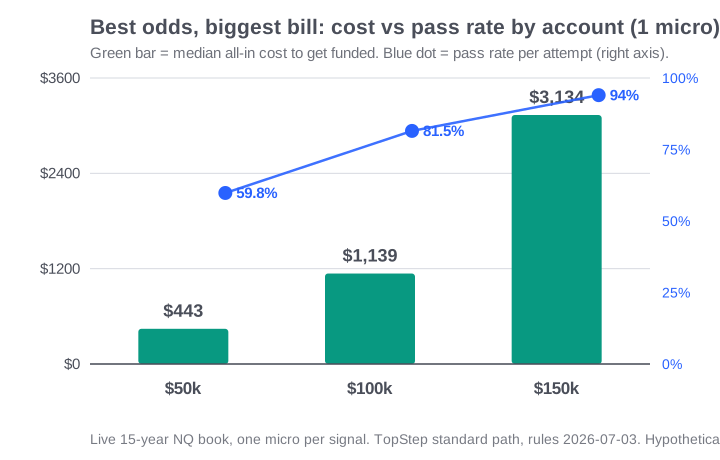
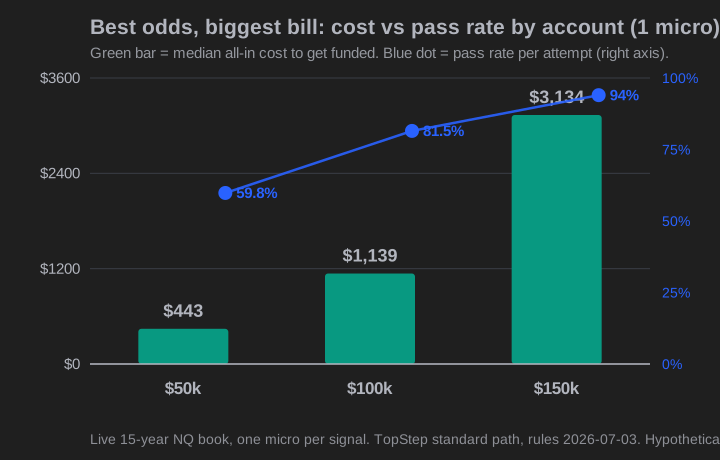
The $50k account passes less often per try, but its monthly fee is $49 against $199 for the $150k, and its $3,000 target sits close enough that most attempts finish inside a month or two. Add resets and it is still the cheapest funded path in the grid. The bigger accounts buy higher odds at a price that rises much faster than the odds do.
The $150k passes so easily because its trailing room is $4,500 against the $50k's $2,000, so a normal dip in our book fits inside it far more often. If your goal is simply to get funded for the least money, the small account is the answer for our book. If you want room to breathe and can pay for it, the bigger account buys survival, not savings.
The formula you can run on your own numbers
You do not need our simulation to price your own path. The reset math is simple arithmetic once you have two inputs: your per-attempt pass rate, and how many whole months a typical attempt lasts.
E[attempts] = 1 / P(pass). E[total spend] = (expected attempts worth of monthly fees) + $149 activation, charged once on the funded pass. So at a 55% pass rate you expect 1.81 attempts; at 28% you expect 3.57. Multiply attempts by the fee-months each one burns, add the one activation, and you have your all-in cost.
Get the pass rate by running your trade history against the combine's floor and target. Get attempt length from how many months your typical passing and failing runs take. The formula does the rest. One catch: it assumes your attempt length holds steady. Fees accrue by the calendar, not by the trade, so if your cadence slows, the bill climbs even when your pass rate does not move.
Where this stops being exact
Two honest limits, and they pull in opposite directions.
First, the shuffle destroys day structure. Reordering trades scrambles which trade fell on which day, so we do not model TopStep's consistency rule (your best day must stay at or below 50% of the target) or the daily loss limit. Both can add failed attempts our number never sees. This limit pushes our cost figures too low.
Second, our simulated floor trails each trade's intraday favorable excursion, which is stricter than TopStep's actual end-of-day-balance trailing. A stricter floor blows more attempts, so this limit pushes our cost figures too high. It is the mirror of why a live drawdown usually runs deeper than the backtest: here the modeled combine is harder than the real one.
We did not net these two out, and we will not pretend to know which wins. What we do trust is the ordering, not the exact dollars: two micros beat one micro in 99% of resampled histories, and the small account beat the big one on both verification legs. That is a measured result now, not a hunch. In the worst 2.5% of streak-preserving resamples of our 15-year book, the $50k combine's per-attempt pass rate falls to 44.2%, closer to two tries in five than to half, and the median all-in bill runs as high as $541. Treat the point figures as our book's approximation, not a promise about your account.
One more scope limit. Every resampling reuses the same 3,500 trades, and over half our net profit sits in about 1% of them. The bands measure sampling noise around one realized 15-year path, not performance on a market we have not seen.
A short note on other firms. Apex's intraday evaluations trail the peak balance in real time, including open unrealized gains, and carry no daily loss limit. That is a different mechanic from TopStep's end-of-day-balance floor (Apex rules read 2026-07-03). We did not run Apex through the sim, and its promo pricing swings 80 to 90%, so we quote no Apex cost number, only the rule difference. We are not affiliated with any prop firm, and rules change; check the source before you act.
What to do with this tomorrow
If you are choosing a combine, do not shop on pass rate alone. Shop on expected total spend with resets included, which is the number that actually leaves your account, and read the payout side before you buy, because a consistency cap can hold your money back long after you pass: the consistency rule versus a fat-tailed system. For our book that meant the $50k account, and on the $50k it meant small fast size beat big slow size on the money even though it passed less often.
Then run the formula on your own trades. Two inputs, one line of arithmetic, and you have your own version of the grid instead of a stranger's point estimate.
How we measured this
Instrument: NQ (CME E-mini Nasdaq-100), modeled at micro scale as mini dollars divided by ten, one to three micros per signal. Data: our production v8 book's full TradingView deep-backtest trade list, single-slot export, 3,500 trades, 2011 to 2026 (data as of August 5, 2026), commissions and slippage included, $1,112,232.40 net (reconciles exactly to our canonical stats; the simulation aborts if the parse does not reproduce that pair). Combine simulation: trade-shuffle Monte-Carlo, 20,000 orderings per cell for the pass rate and 50,000 full funding paths per cell for the spend distribution, against TopStep's parameters captured 2026-07-03 from their help center. Room and target by account: $50k is $2,000 / $3,000; $100k is $3,000 / $6,000; $150k is $4,500 / $9,000. Standard-path pricing: $49, $99, $199 per month plus $149 activation once, per the pricing article. Each attempt ends at the first of pass (target reached) or blow (floor touched); total spend counts whole-month fees across every attempt plus the single activation on the funded pass. Monte-Carlo standard error on a 50% rate at 20,000 iterations is about 0.35 points. We verified every figure two independent ways: a seeded simulation and a separately written unseeded re-implementation, which agreed within Monte-Carlo noise. Robustness bands: we put a 95% confidence band on the headline numbers with a 1,000-draw moving-block bootstrap that resamples the trade list in 20-trade blocks, long enough to keep every losing streak intact. The $50k / 1-micro pass rate lands at 55.4% [44.2%, 66.5%] and the median all-in cost at $443 [$394, $541]; the $50k / 2-micro pass rate lands at 28.0% [22.3%, 34.8%] and its median all-in cost at $345 [$296, $394], and two micros beat one micro on median cost in 981 of 1,000 resampled histories. This bootstrap is a re-implementation of the documented method (moving block, 20-trade blocks, 1,000 draws) with an inner Monte Carlo of 600 orderings rather than 20,000, so its bands are wider by construction and are not like-for-like with any band we published before. The $100k and $150k cells were not bootstrapped on this basis and carry no band. The bands held under a second RNG, a longer block length, and a stationary-bootstrap scheme. The bootstrap adds sampling uncertainty only. It does not correct the two modeling biases above.
What would falsify the cost ordering: a trade distribution whose failed attempts run much longer than ours, which would erase the two-micro savings by adding fee-months to every reset. Our numbers are our book's; the method is anyone's. We tested this book on every major index in our strategy research, and the backtested record is on the tear sheet. If you want the signals that produced the trade list behind this math, that is the one thing we sell.
STS Research. Educational content, not investment advice. We trade this book live and sell access to its signals; judge the data accordingly. We have no relationship with TopStep, Apex, or any prop firm, and their rules and prices change; every rule here is dated to its 2026-07-03 capture.
CFTC Rule 4.41: Hypothetical or simulated performance results have certain limitations. Unlike an actual performance record, simulated results do not represent actual trading. Also, since the trades have not been executed, the results may have under- or over-compensated for the impact, if any, of certain market factors, such as lack of liquidity. Simulated trading programs in general are also subject to the fact that they are designed with the benefit of hindsight. No representation is being made that any account will or is likely to achieve profit or losses similar to those shown.
Past performance is not indicative of future results.