Prop account sizing: the optimal contract multiplier does not exist
A prop account is a linear book inside a fixed dollar box.
Your position size scales. Double the contracts and every day's profit and loss doubles. The rules around you do not scale with it. The trailing drawdown is $2,000 on a 50K account at all three firms we checked. Apex's Safety Net is $52,100. Take Profit Trader's buffer is $52,000. An Apex EOD qualifying day is $250. Constants sitting against a variable, and that is the entire structure of the problem.
Two of those constants reward trading larger. One punishes it.
This article does not end with a number, and the reason is not caution. Both effects run in one direction across the whole tested range, so there is no size where the tradeoff turns around. What the arithmetic gives you instead is two clean answers, one for each objective a trader can actually hold, and the numbers to see which one is yours. That survives a change of account, of firm, or of book. A multiplier does not.
What scales and what does not
Three fixed dollar quantities govern a funded prop account, each interacting with size in its own direction.
The trailing drawdown punishes size, linearly and without mercy. A $2,000 floor absorbs a given sequence of losing trades exactly once. Double the size and the same sequence eats twice the floor, and nothing about the floor grows to compensate.
The buffer rewards size. Apex will not release profit until the balance is above $52,600, and Take Profit Trader until it is above $52,000. A fixed amount of profit to accumulate, so a larger size fills it in fewer days.
The qualifying-day threshold rewards size, and this is the one traders miss. Apex counts only days of $250 net or more on the EOD product and $200 on the Intraday product. Topstep's Standard path counts winning days of $150 or more. A profitable day below the line does not count at all. On our book, at one micro, only 28.5% of profitable days clear $250. At six micros, 72.7% do.
| Micros | Days clearing $150 | Clearing $200 | Clearing $250 | Share of profitable days clearing $250 |
|---|---|---|---|---|
| 1 | 499 | 392 | 336 | 28.5% |
| 2 | 702 | 630 | 558 | 47.2% |
| 3 | 824 | 728 | 669 | 56.6% |
| 4 | 890 | 824 | 743 | 62.9% |
| 5 | 943 | 872 | 824 | 69.8% |
| 6 | 973 | 924 | 858 | 72.7% |
| 8 | 1,023 | 973 | 935 | 79.2% |
| 10 | 1,060 | 1,011 | 973 | 82.4% |
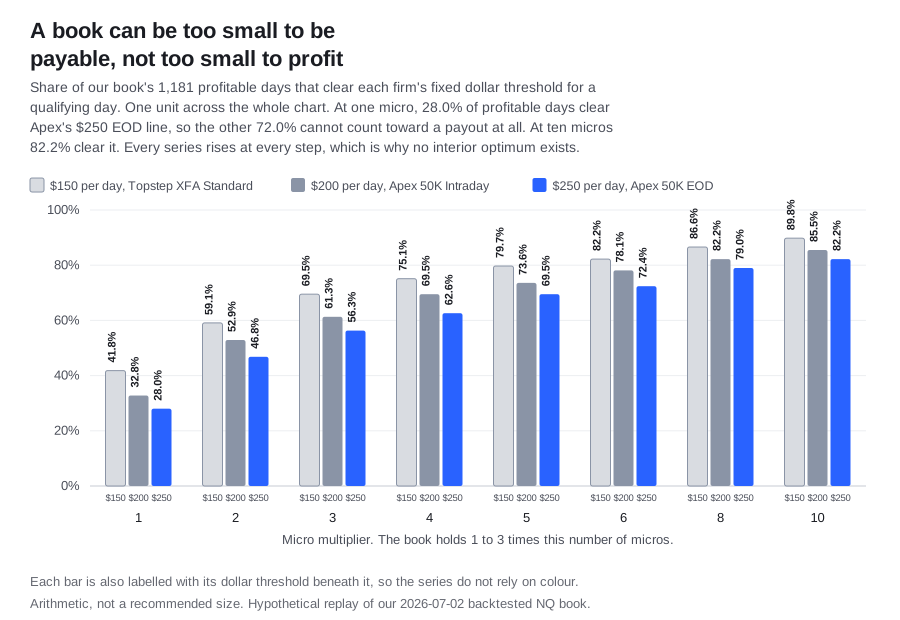
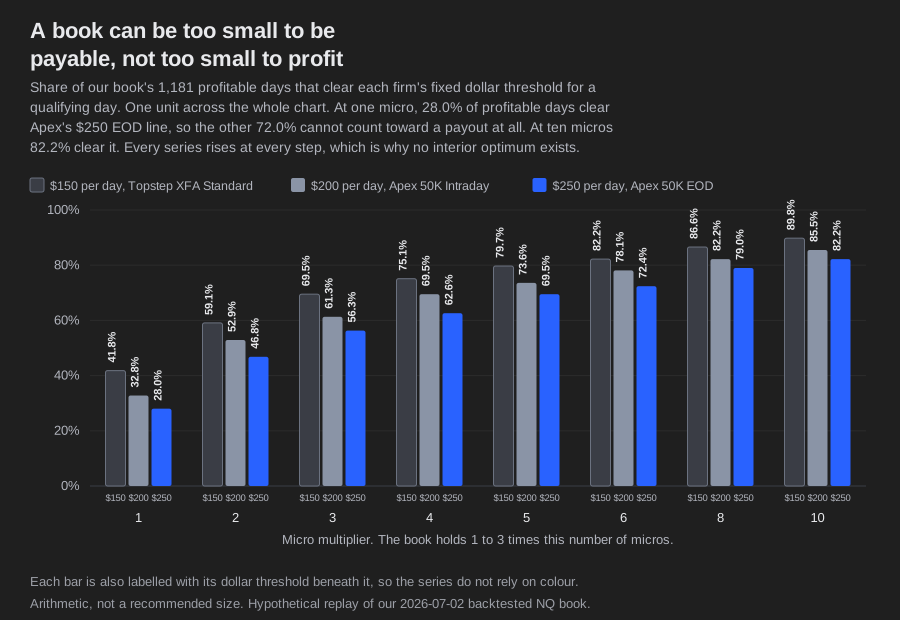
Out of 2,540 exit days, 1,181 were profitable. Everything above is a property of a fixed dollar threshold applied to a book scaled by a constant, not a property of any trader's skill. Scale any book down far enough and a majority of its profitable days stop counting toward a payout.
Run this table on your own system before you pick a size. Take your daily net P&L history and multiply it by each size you are considering. Count what share of your profitable days clears the qualifying floor of the account you are buying. That percentage is the number the firm's product page does not show you, and it moves further on a size change than anything else in the rulebook.
The two curves
Put the reward and the punishment on the same axis.
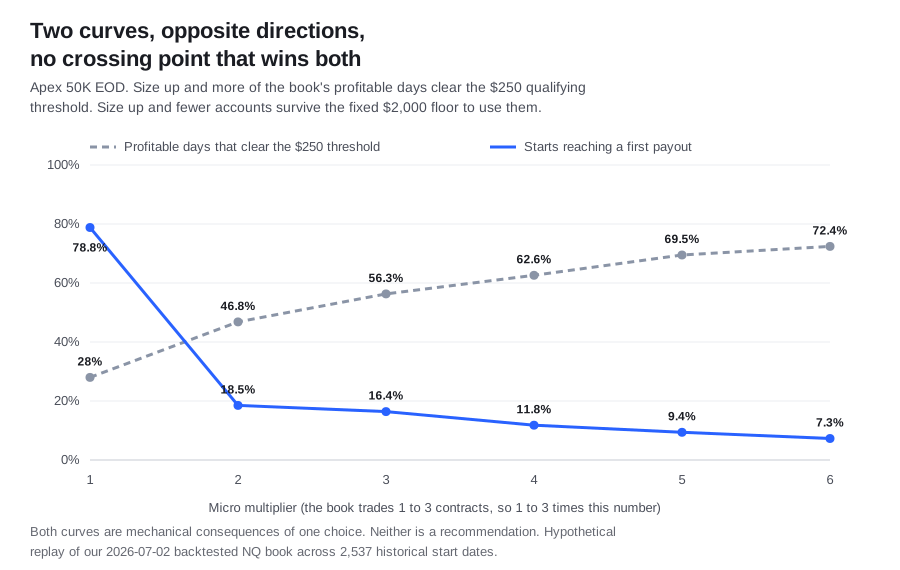
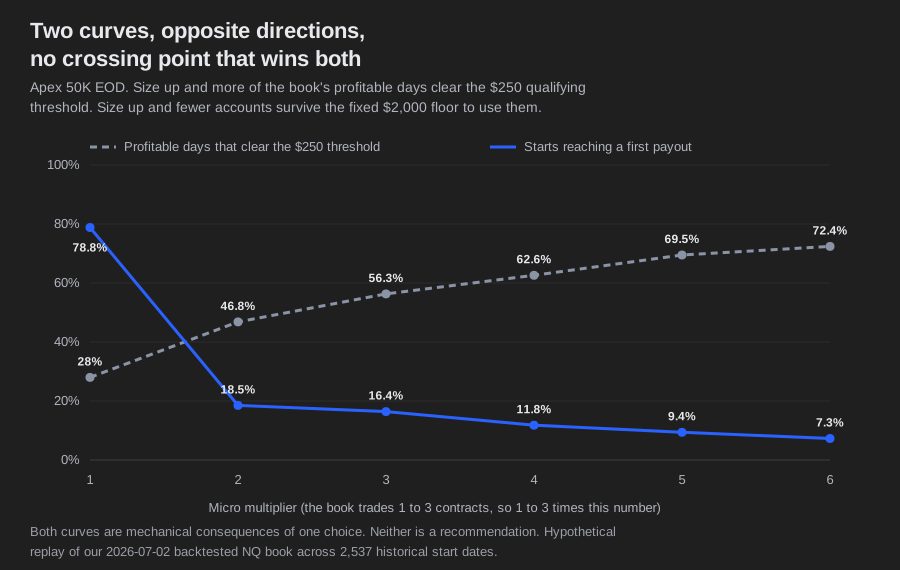
The two lines cross between one and two micros. That crossing is not an answer. The curves measure different things in different units, one a share of days and one a share of accounts, and a crossing between incommensurable quantities carries no information. We say so because a chart shaped like this invites exactly the wrong reading.
The information is in the shapes. Both series are monotone across the entire tested range. The qualifying share rises at every step from one micro to ten. The share of starts reaching a first payout falls at every step from one to six. Neither has an interior maximum. There is no size at which the rules stop punishing you for being larger, and none at which they stop rewarding it.
An interior optimum is a specific mathematical object: a size that beats the sizes on both sides of it. On this book, against these rules, no such size exists anywhere in the tested range. Anyone who names one is either optimising an objective they have not told you about, or has not checked both curves.
The two answers, and how to tell which one is yours
An optimum requires an objective. There are two coherent ones here, and the arithmetic answers both. They point in opposite directions, which is the finding.
| If your objective is | The arithmetic says | On our book, at Apex 50K EOD | You are choosing this if |
|---|---|---|---|
| Maximise the chance of ever being paid at all | The smallest size you can trade | 1 micro: 78.7% of starts reached a first payout, median 762 days | The evaluation fee is money you would rather not spend twice, and a slow payout still counts as a payout |
| Minimise days to a first payout, given that you get there | Trends toward the largest size the rules allow | 6 micros: median 46.5 days, but only 7.2% of starts reached one | You are treating the evaluation fee as a repeatable ticket price and you would rather fail fast than wait |
Neither row is safer than the other in any absolute sense. The first spends time, the second spends attempts, and only you know which of those you have more of.
The trend in the second row is real but not clean. On our book the median at three micros, 196 days, was longer than at two micros, 108.5, because the population that survives to be measured changes with size. Read the medians as a direction, not as a schedule.
Write your objective down before you pick a size, because the two sensible objectives have opposite answers. Maximising the chance of ever being paid points at the smallest size you can trade. Minimising days to a first payout points at the largest. A size chosen without naming which one you want is a size chosen for you by whichever number you happened to read last.
We will not choose between them for you. That choice depends on your capital, your tolerance for repeated evaluation fees, and how much a slow payout is worth against no payout, none of which we know. If you are working through the "get paid soonest" branch, the firm-by-firm timing is the fastest route to a first payout. If you are working through the "survive at all" branch, start with what a $2,000 floor actually holds and the real dollar difference between a mini and a micro.
The contract cap is not the binding constraint
There is one more fixed number, and it turns out to matter least.
| Firm | Published contract limit, 50K | Where it binds on a book that peaks at 3 minis |
|---|---|---|
| Topstep 50K Combine | 5 minis or 50 micros, micros count 10 to 1 | 16 micros |
| Take Profit Trader 50K | 6 contracts or 60 micros | 20 micros |
| Apex 50K Performance Account | 4 minis or 40 micros, scaling by profit tier from Level 1 | 13 micros at the top tier |
Our book holds one position at a time and sizes 1 to 3 minis by volatility, so a multiplier of M means it holds 1 to 3M micros. The caps do not bind until M is 13 or higher. By that point the share of starts reaching a first payout has already fallen from 78.7% at one micro to 7.2% at six, and it is still falling. The floor binds first, by a wide margin, at every firm.
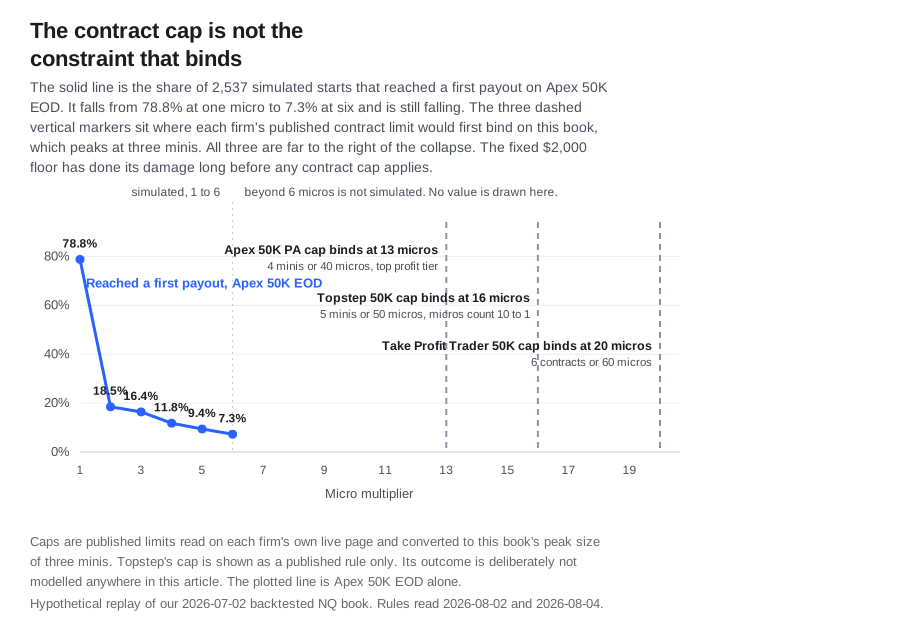
The contract limit on the product card is not your sizing constraint. On this book the caps do not bind until 13 to 20 micros, and the share of starts reaching a payout has already collapsed from 78.7% to 7.2% by six. Size against the $2,000 floor, which is the number that actually stops you, not against the cap, which is the number that is advertised.
Four things this arithmetic does establish
None of them is a size. All four are properties of the rules, and all four change what you do.
A book can be too small to be payable. Not too small to be profitable, too small to be counted. At one micro our book had 1,181 profitable days and 850 of them could not have contributed to an Apex EOD payout. A trader in that position is doing everything right and watching the day counter refuse to move. If that is you, the fix is not to trade better, it is to check the qualifying floor of the account you bought against the size you can actually carry.
The drawdown mechanic matters as much as the size. Apex's intraday product ratchets the floor on peak balance including unrealized gains. At one micro it reached a first payout on 56.5% of starts, against 78.7% for the end-of-day product. Same trades, same size, and the intraday product was lower at every size tested. Choosing the mechanic is a sizing decision even though it is not stated as one. At Apex it is made at purchase and cannot be converted later, so decide it before checkout.
The evaluation is the easy half at every size. Even at six micros, 30.3% of starts passed the Apex EOD evaluation. Only 7.2% ever produced a payout. Sizing up buys evaluation passes far more readily than it buys withdrawals. Do not read a pass rate as a payout rate, or price an evaluation as if passing it were the finish line.
Size interacts with the consistency caps as well as with the floor. Apex caps a single day at 50% of profit since the last payout and Topstep's fast path at 40% of total net profit. Size does not change those ratios. It does change how many days you accumulate before you request, and a system whose profit arrives in a few large days collides with a short-cycle cap by construction.
The limits of this analysis
Every rule here was read on the firm's own live page on the date stamped beside it, and the source pages are linked at the end. Prop firms change rules without notice: Apex re-ruled its entire product line on 1 March 2026 and one current Apex help page still carries retired Legacy payout wording. Re-read the rule yourself before acting on it. We are not affiliated with any prop firm.
On our side: the replay is a hypothetical what-if on a real 15-year TradingView export. An automated reconciliation check gates it, and refuses to run if the parse does not reproduce 3,500 trades and $1,112,232.40 net.
Scaling is exact in one sense: one MNQ micro is one tenth the dollar value of one NQ mini. But it is a scaling of an already-executed backtest, and it assumes fills are unaffected by size. For micros on NQ that is a reasonable assumption, and still an assumption.
A day is an exit day, and its net is the sum of that day's closed trades. The intraday floor is reconstructed from each trade's own favorable and adverse excursion, exact for a book holding one position at a time. All figures are hypothetical backtest performance, not a live account and not a payout record.
Topstep is deliberately not simulated. Topstep flattens all positions at 3:10 PM CT, which is 4:10 PM ET, and our book's end-of-day exit is 4:45 PM ET. 57.9% of its trades are not closed before that deadline. Pricing a Topstep run would need an intraday mark-to-market at 4:10 PM ET that the trade export does not contain. Its published limits are reported; its outcome is not modelled.
Every figure above came from replaying one published book at eight sizes. You can only run this arithmetic on a system whose per-day P&L you actually hold, which rules out most of what gets sold to prop traders. Ours is published trade by trade, which is why we can show you the size curve rather than assert a size.
Where these rules came from
Every firm rule above was read in a browser, on the firm's own live page, on the date stamped beside it. No search snippets, no cached pages, no third-party comparison sites: prop firms retire rules faster than the rest of the web catches up, and a retired rule reads exactly like a current one. The pages this article works from:
- Apex: EOD payouts, intraday payouts, intraday trailing drawdown explained, choosing the right platform, contract limits and the daily loss limit
- Topstep: Trading Combine parameters, maximum loss limit, payout policy
- Take Profit Trader: account sizes and drawdown, PRO withdrawals and the buffer
Any of these can change tomorrow with no announcement. Read the page yourself before you pay, and if it now says something other than what is quoted here, the firm's page wins.
Rules we could NOT verify, and therefore did not state
| Firm | Item | Status |
|---|---|---|
| Apex | The MICRO-contract equivalent at each Performance Account profit tier | UNVERIFIED. The page gives "4 contracts / 40 micros" at the top and "Level 1 = 2 contracts" at the bottom, without stating the micro equivalent per level. We use the top-tier cap only, and nothing in this article rests on the per-level figures |
| Take Profit Trader | Any minimum-days or consistency requirement at payout, and any maximum withdrawal | UNVERIFIED. Not published. Not used in this article |
| Apex | The requirement for the SECOND and later payouts | CONFLICTING and live today. Not used in this article, which concerns the first payout only |
| Topstep | Whether an overnight Globex hold is permitted | CONFLICTING on Topstep's own page. Not load-bearing here |
| All | Whether fills degrade at larger micro size | Not verified and not verifiable from a trade export. Assumed unaffected, which is stated in the limits section |
Every trade behind these numbers is on the tear sheet, the strategies are on our strategies page, and the signals are what we sell.
Disclosure. We trade this book live and sell access to the signals, so judge the data accordingly. This article is educational and is not investment advice, a recommendation, or an offer to buy or sell any security or futures contract, and it is not a recommendation of any prop firm, account type, or position size. Position sizing decisions are yours and depend on circumstances we do not know. Nothing here is a projection of income, and no payout scenario described is a promise that any account will produce one. We have no affiliation with Topstep, Apex Trader Funding, Take Profit Trader, or any prop firm. Every rule cited was read on the firm's own live page on the date shown and can change at any time.