Why the STS NQ Signal Backtest Holds Up: It Passes Two Overfit Tests and Made a Profit in Every Four-Year Era
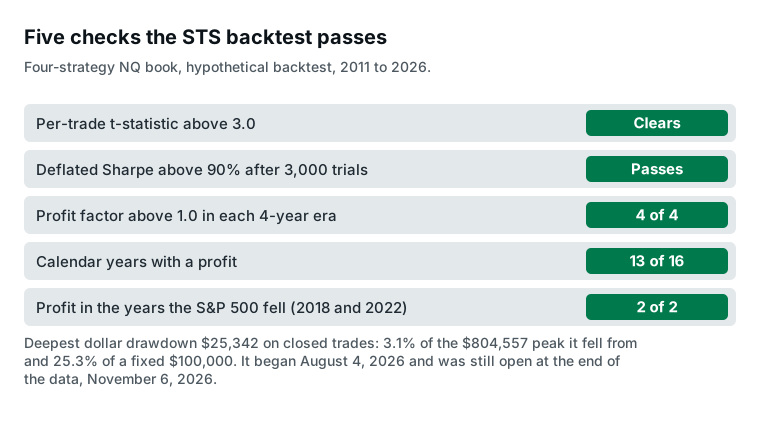
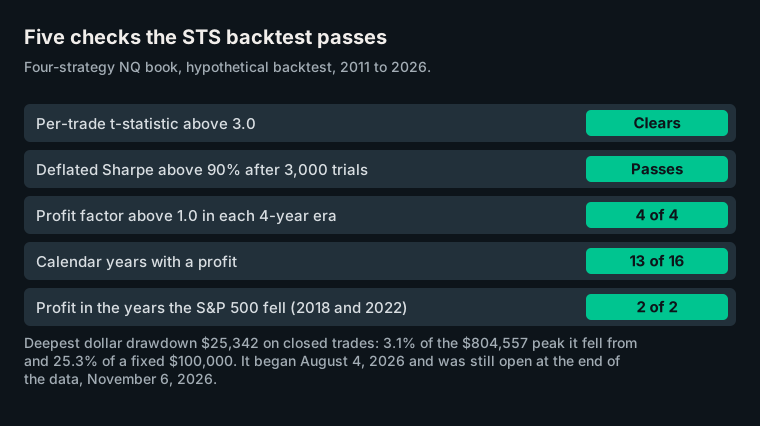
Short answer. The 15-year backtest behind STS's NQ signals passes two standard overfitting tests: its per-trade t-statistic clears the 3.0 bar, and its Deflated Sharpe ratio passes 90% after deflating for 3,000 trials. Its profit factor was above 1.0 in all four 4-year eras, rising from 1.05 to 1.73, and it made money in 2018 and 2022, the two full years since 2012 when the S&P 500 fell. These are hypothetical backtest results.
These are the backtested trades of our four systematic NQ strategies, run as one book that holds one position at a time, on the NQ mini, 1 or 2 contracts a trade (2 when daily ranges are small, 1 when they are large; every trade since July 2024 has been 1 contract). They are momentum and trend trades, intraday plus one overnight strategy. The tests work on any trader's system; our numbers describe ours.
How can you tell if a backtest is overfit?
Run it through tests built to catch overfitting, such as the t-statistic and the Deflated Sharpe ratio. Our backtested book passes both. Overfitting means tuning rules until they fit past noise, which makes a backtest look great right up until it meets new prices.
The t-statistic asks whether the average trade sits far enough from zero, given how noisy trades are, to be unlikely to be luck. Campbell Harvey, Yan Liu and Heqing Zhu argue for a bar of 3.0 rather than the usual 2.0, because so many ideas get tested before one is published. Across 3,139 trades, our book clears 3.0.
The Deflated Sharpe ratio, from David Bailey and Marcos López de Prado, shrinks a Sharpe ratio, return measured against its day-to-day swings, for the number of versions tried and for lopsided, fat-tailed returns. Ours passes the 90% threshold after counting 3,000 trials against it.
Does the edge hold up through bull and bear markets?
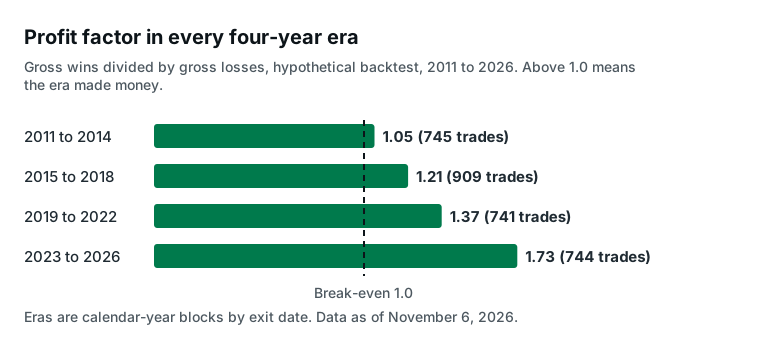
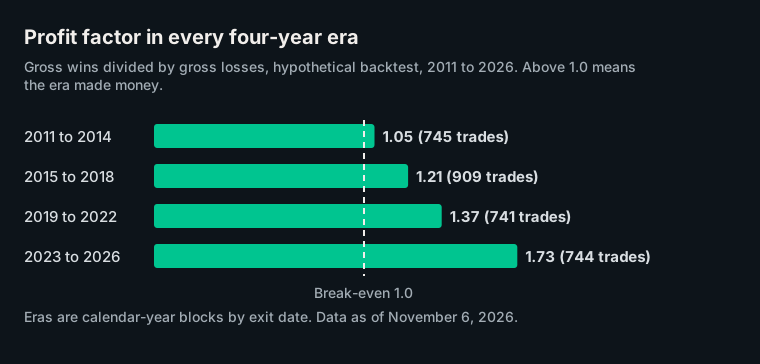
Yes, in our backtest. The profit factor, gross wins divided by gross losses, stayed above 1.0 in every four-year era and rose each time, from 1.05 in 2011 to 2014 to 1.73 in 2023 to 2026, on 741 to 909 trades per era.
In the backtest, 13 of the 16 calendar years made money.
In the 14 full years from 2012 to 2025, the S&P 500 fell twice, in 2018 and 2022, even with dividends reinvested. In the backtest, the book made money in both: $24,944 in 2018 and $52,017 in 2022. For the full bear-market breakdown, see whether an NQ strategy only works in a bull market.
Over the whole backtest, the deepest drawdown in dollars, the largest fall from a peak, was $25,342 on closed trades, 3.1% of the $804,557 peak it fell from, or 25.3% of a fixed $100,000 account. It began on August 4, 2026 and was still open on November 6, 2026. Counting open trades, it reached $28,515.
If you trade micro contracts (MNQ), NQ vs MNQ shows how the two sizes compare.
Why trade four strategies as one book?
Because the combined book is steadier than any of its parts, and each part earns its place.
On the same Sharpe ratio basis, the book scores 1.27. Each strategy, measured on its own trades inside the book, scores between 0.67 and 0.89.
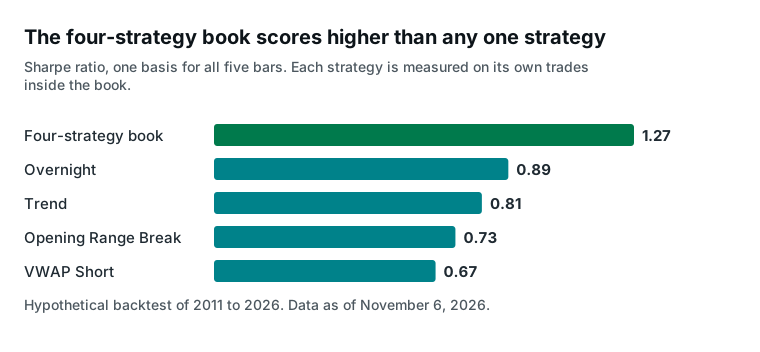
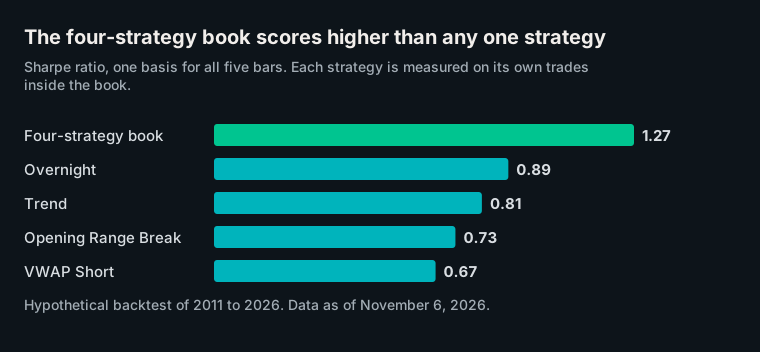
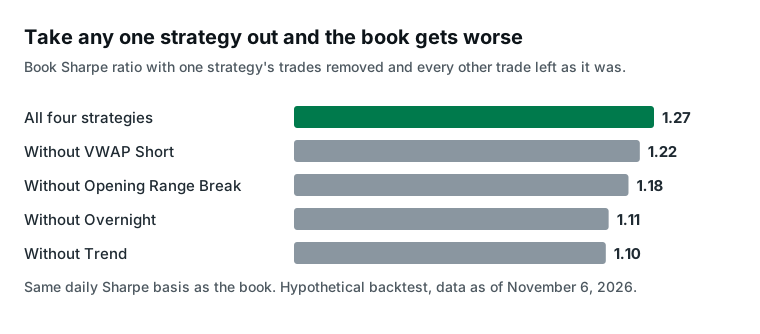
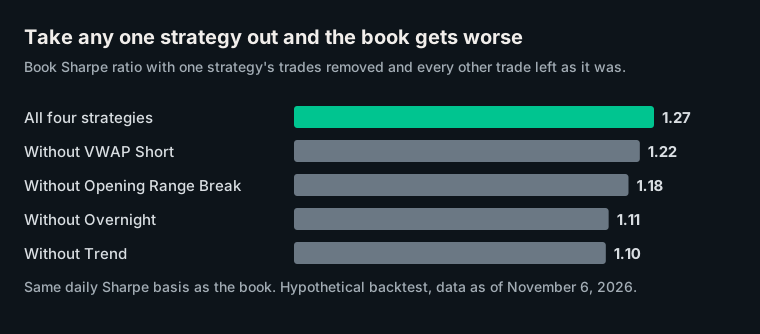
We also took each strategy's trades out of the record, one at a time, and left every other trade as it was. The book's Sharpe fell every time, to between 1.10 and 1.22, and the book still cleared the 3.0 t-statistic bar with any one strategy removed. No strategy is a passenger.
The book holds one NQ position at a time, so its four strategies take turns rather than stacking risk, and every STS signal comes from it. Our strategies page shows how each one trades.
How we measured this
Every figure comes from our TradingView backtest of the four-strategy NQ book, 2011 to 2026, data as of November 6, 2026: 3,139 trades at 1 or 2 NQ contracts, with commissions and two ticks of slippage on market and stop fills. All results are hypothetical.
The t-statistic uses each trade's percentage return. The Sharpe ratio uses daily returns over every weekday, counting days with no exit as zero, against running equity from $100,000, annualised. The Deflated Sharpe deflates the book's 1.27 for 3,000 trials and for the skew and fat tails of those daily returns.
Each strategy's Sharpe uses its own trades on the same basis. Eras and years are calendar blocks by exit date, and the S&P 500 years use its total return index, year-end close to year-end close.
Every test here runs on the same history the rules were built on, which is why the Deflated Sharpe counts trials against the result. A t-statistic below 3.0, a Deflated Sharpe below 90%, or any era with a profit factor below 1.0 would have contradicted these findings.
What this means for you
Ask any signal service for these tests before you look at its equity curve. Ours are above, run on a hypothetical backtest, and the full record is on our tear sheet.
Each signal arrives by email and on the dashboard, and you place your own orders. Membership is $50 a month or $500 a year, and you can cancel anytime; see pricing.
We trade this book live and sell access to the signals, so judge the data accordingly. This article is educational and is not investment advice. Futures trading involves substantial risk of loss and is not suitable for every investor.
Hypothetical Performance Disclaimer (CFTC Rule 4.41): These results are based on simulated or hypothetical performance results that have certain inherent limitations. Unlike the results shown in an actual performance record, these results do not represent actual trading. Also, because these trades have not actually been executed, these results may have under- or over-compensated for the impact, if any, of certain market factors, such as lack of liquidity. Simulated or hypothetical trading programs in general are also subject to the fact that they are designed with the benefit of hindsight. No representation is being made that any account will or is likely to achieve profits or losses similar to these being shown.
Past performance is not necessarily indicative of future results. Futures trading involves substantial risk of loss and is not suitable for all investors.
See what STS NQ futures signals are and how they reach you and our forward record, every live signal we have sent, dated and public.