Does the STS NQ strategy do better or worse on FOMC, CPI and jobs-report (NFP) days?
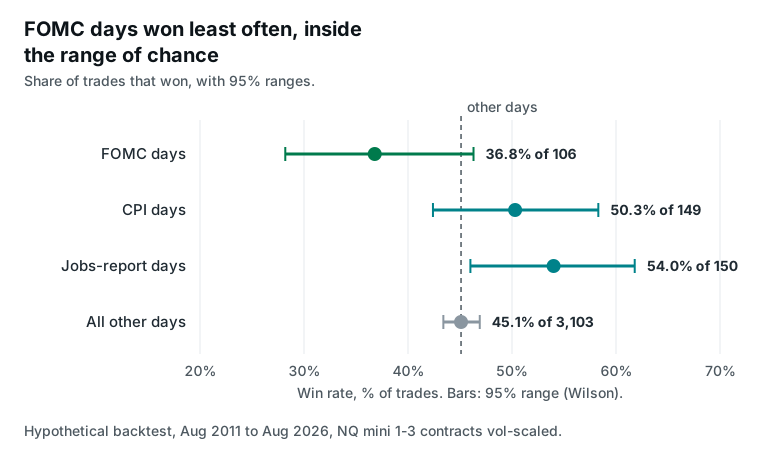
Short answer. No measurable difference. In our hypothetical 2011-2026 NQ backtest, FOMC days won least often, 36.8% of 106 trades against 45.1% of 3,103 on ordinary days, and jobs-report days won most often, but with 15 comparisons run, gaps that size fall within what chance produces.
Many traders treat Fed and data days as special. We tested that belief on our own book, and the lesson reaches past news days: check enough slices of any record and one can look special by luck alone. The last section covers what this means on a prop-firm account with a news rule. All figures are hypothetical backtest results on NQ mini, 1 to 3 contracts scaled by volatility, except one live signal, marked where it appears.
How did the book do on each type of release day?
Every release type was profitable in this hypothetical record. Win rates, the share of trades that made money, ran from 36.8% on FOMC days to 54.0% on jobs-report days, against 45.1% on ordinary days, those with none of the three releases.
The book traded on 295 of the 456 release days, at 0.87 trades per release day against 0.95 on ordinary days. The 456 days carry 466 releases, because 10 days had two.
| Day type | Days | Trades | Net P&L | Win rate | Avg profit per trade | Worst trade |
|---|---|---|---|---|---|---|
| FOMC statement | 119 | 106 | $53,227 | 36.8% (39 of 106) | $502 | -$4,164 |
| CPI release | 177 | 149 | $61,605 | 50.3% (75 of 149) | $413 | -$5,784 |
| Jobs report (NFP) | 170 | 150 | $80,267 | 54.0% (81 of 150) | $535 | -$7,458 |
| Any of the three | 456 | 397 | $193,754 | 48.1% (191 of 397) | $488 | -$7,458 |
| All other days | 3,272 | 3,103 | $918,478 | 45.1% (1,400 of 3,103) | $296 | -$15,628 |
Hypothetical backtest, NQ mini, 1 to 3 contracts vol-scaled, August 2011 to August 2026. Eight trades fell on days with two releases, so the type rows sum to 405 trades, not 397. The FOMC worst trade is the July 29, 2026 live signal, shown at its backtest figure.
Are these differences real, or could luck produce them?
Luck can produce them. Of 15 comparisons between release days and ordinary days, one cleared the usual 5% bar on its own, and none stands out once all 15 are counted (hypothetical backtest). The 5% bar marks a result luck would produce less than 1 time in 20.
Picture a room full of people, each flipping a coin five times. Someone will probably flip five heads in a row. That person has no skill; the room gave luck many chances. A result that is rare for one person is ordinary for the room.
Our test works the same way. We compared each of the three release types with ordinary days on five measures: win rate, profit per trade, profit per day, profit per contract and percentage return per trade. That makes 15 comparisons, so 15 people in the room.
For each comparison we ranked the release days among random sets of the same number of trading days. That rank is a percentile: 50 is perfectly ordinary, and 2.8 means only 2.8% of random sets did as badly or worse.
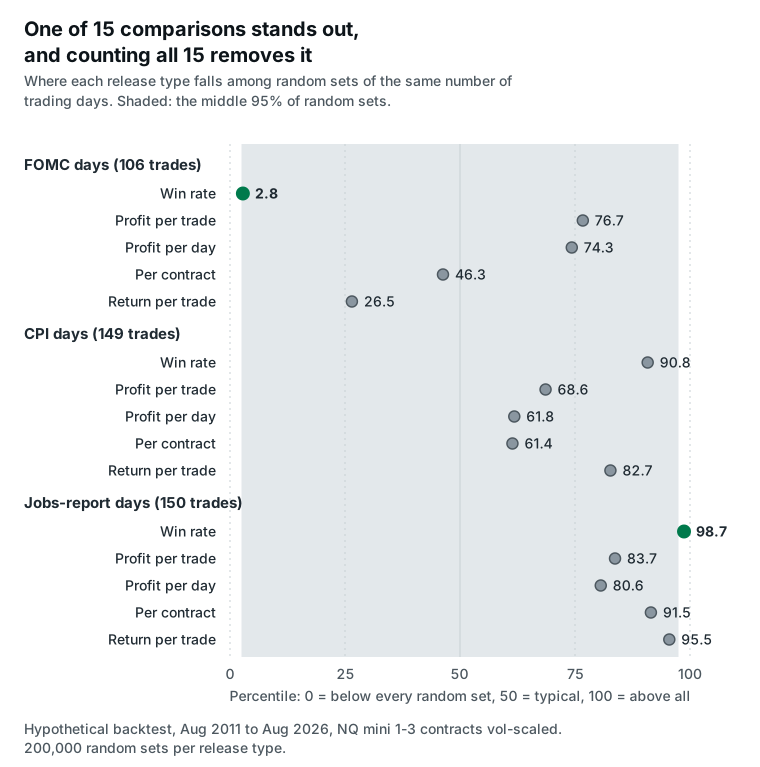
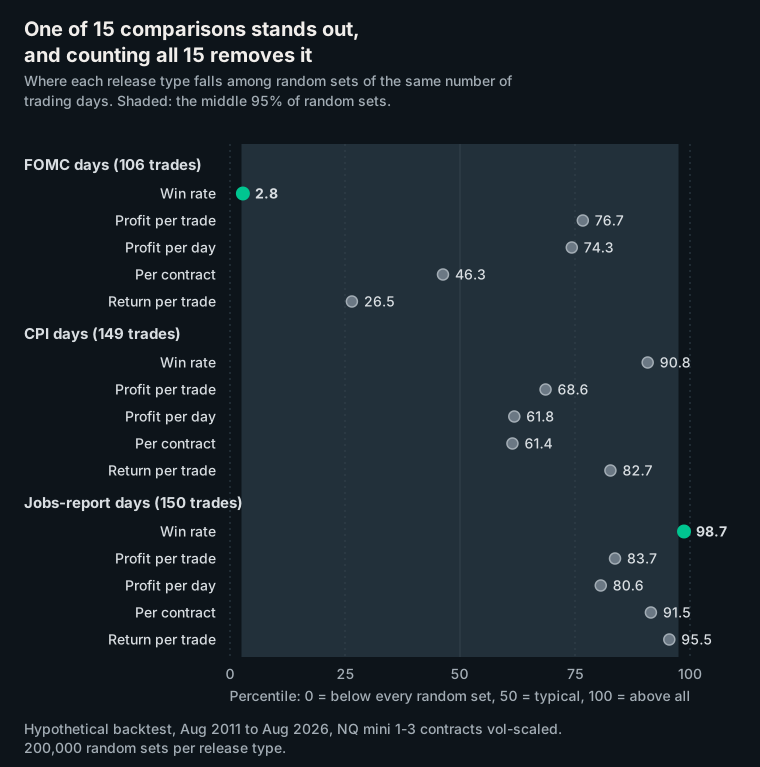
The other 13 sat between the 26.5th and 95.5th percentiles. The two striking ones point in opposite directions: jobs-report days won more often than 98.7% of random sets, and FOMC days less often than all but 2.8%.
The fair test is how often the whole room produces a result that extreme. When we ran all 15 comparisons on random sets of days, at least one was as extreme as the jobs-report result 17.8% to 20.4% of the time, and at least one was as extreme as the FOMC result 34.0% to 38.1% of the time (ranges across ten runs).
Are FOMC days worse for the STS book?
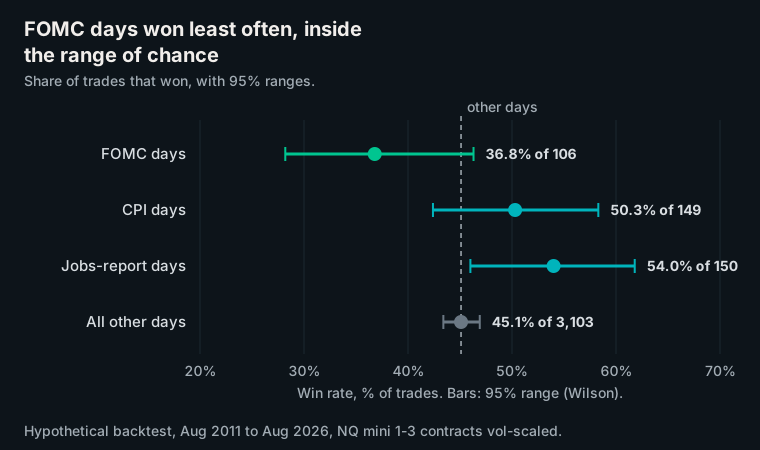
Not measurably. FOMC days netted a hypothetical $53,227 over 106 trades and won least often, 36.8% against 45.1% on ordinary days, a gap within what chance produces once all 15 comparisons are counted.
Even taken alone, the gap is fragile: random sets of 119 trading days won as rarely as FOMC days 2.6% to 3.0% of the time, across ten runs of 20,000 sets. Counting surprises in either direction, high or low, doubles that to about 5.6%, which misses the 5% bar.
Two checks weaken it further:
- Weekday. FOMC statements fall on Wednesdays, 112 of 119, and Wednesdays with no release won 42.7% of 607 trades. Against random sets matched by weekday, FOMC's rate turned up 6.0% to 6.5% of the time.
- Era. FOMC days won 30.5% of 59 trades from 2011 to 2018, against 43.0% of 1,657 on ordinary days. From 2019 to 2026 they won 44.7% of 47, against 47.6% of 1,446.
One strategy carries most of the low rate. Opening Range Break won 12 of 40 FOMC-day trades (30.0%), losing a hypothetical $407 per trade, against 49.2% of 1,136 and a $167 gain on ordinary days. It is the furthest from normal of 15 strategy-and-release combinations, so the room of coin-flippers applies again.
How much of the FOMC-day profit came from one trade?
Most of it. One trade, a $38,823 VWAP Short on December 18, 2024, inside an NQ decline of 22.4% from December 2024 to April 2025, is 73% of all FOMC-day profit (hypothetical).
That is common in small samples: in 22.0% to 22.9% of profitable random sets of 119 trading days, the best trade was at least 73% of the profit.
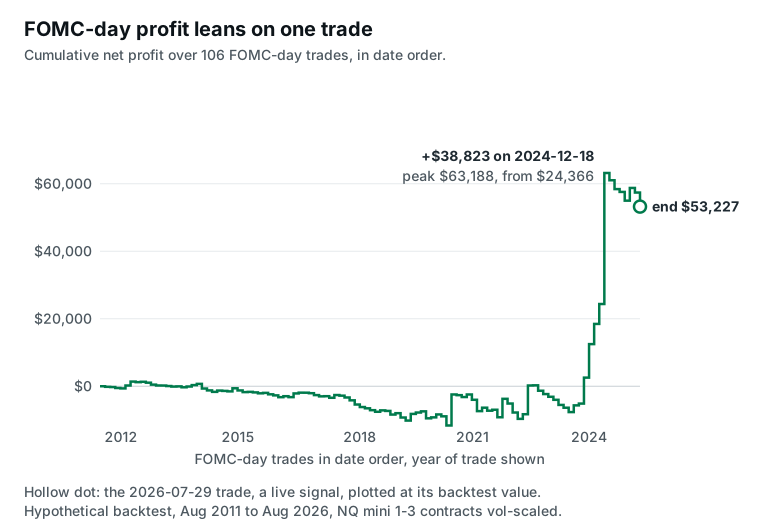
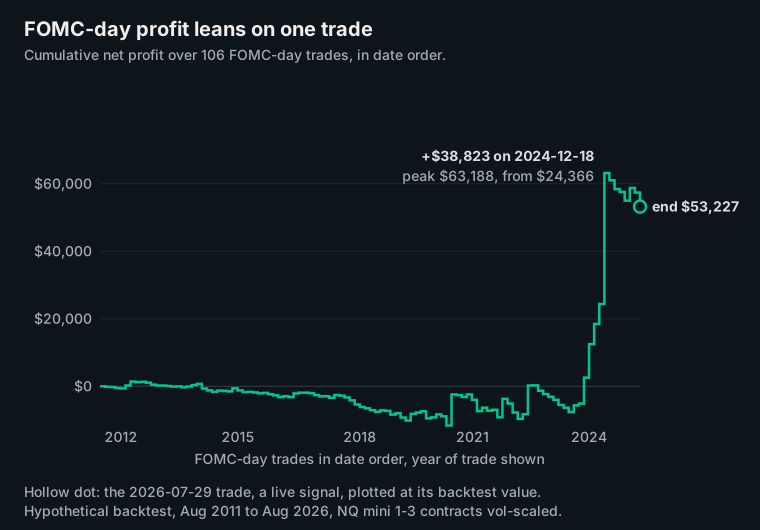
Since that trade, FOMC days have won 1 of 7 trades and lost a hypothetical $9,961. The seventh, on July 29, 2026, came after signals went live on July 6, 2026. The live signal, listed in our first live month, lost $4,170 per NQ mini before commissions; its backtest replay lost $4,164 after costs.
Do release days earn more per day than ordinary days?
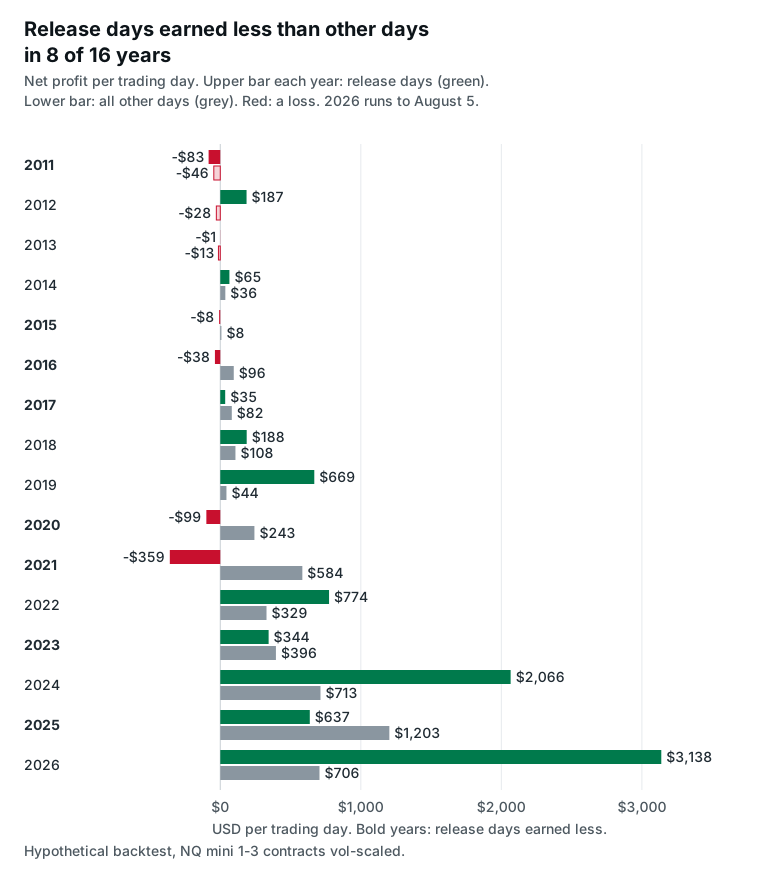
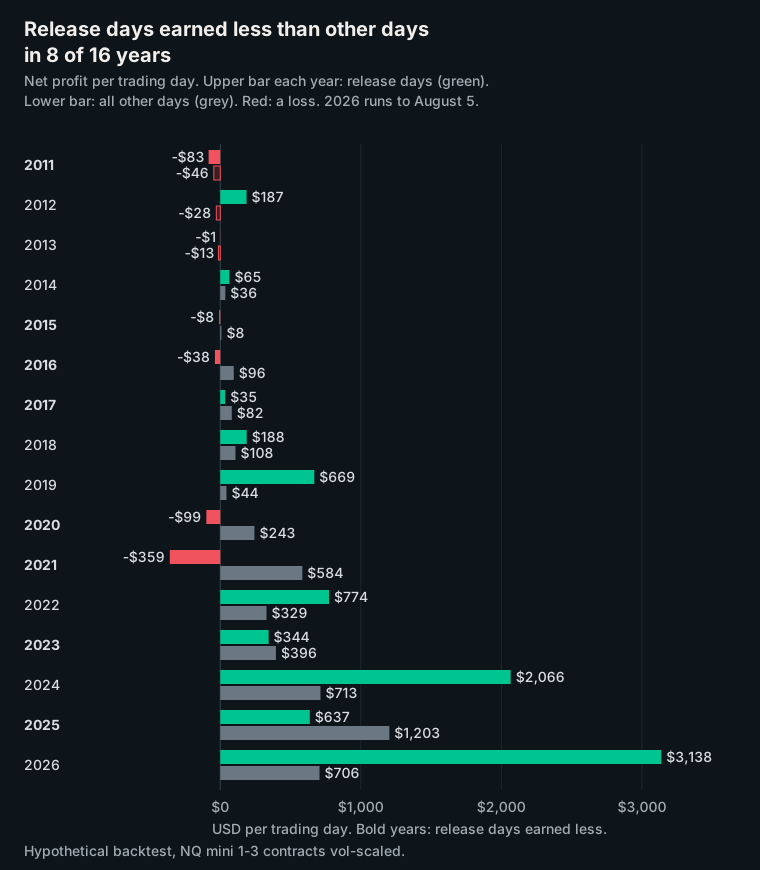
No. Release days earned a hypothetical $425 per trading day against $281 on ordinary days, and random sets of 456 trading days did better 14.4% to 15.9% of the time, across ten runs of 10,000 sets.
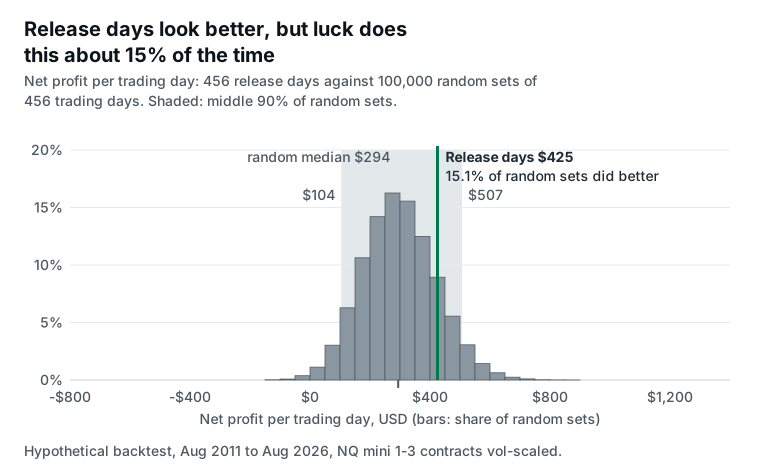
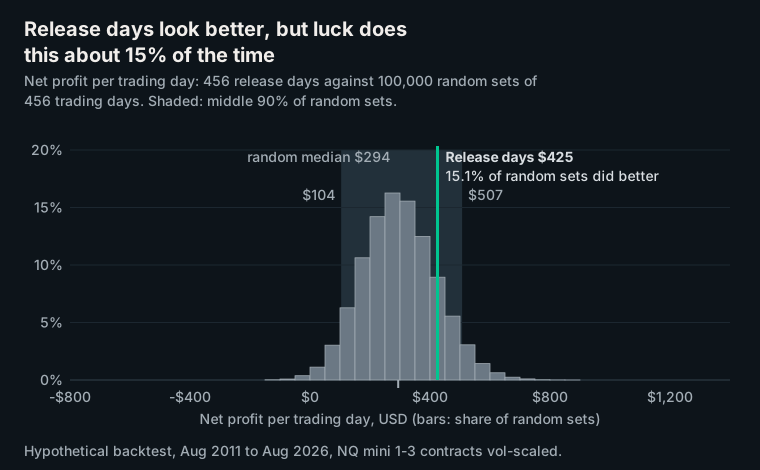
The gap also rests on recent years. From 2011 to 2023, when NQ's lower price meant smaller dollar results per trade, release days earned $145 per day and ordinary days $151. Release days were the weaker group in 8 of 16 calendar years. Of release-day profit, 72% came from 2024 to 2026, against 56% of ordinary-day profit.
Is the book holding a position when a number comes out?
Sometimes. The book held a position through 93 of the 466 releases that fell on trading days, about 6.2 a year, meaning a trade opened before the release and closed after it. Those trades netted a hypothetical $45,532.
| Release | Releases | Held through | Net P&L | Won | Worst trade |
|---|---|---|---|---|---|
| FOMC statement | 119 | 28 | $28,759 | 12 of 28 (42.9%) | -$2,618 |
| CPI, 8:30 AM ET | 177 | 31 | $7,686 | 16 of 31 (51.6%) | -$5,268 |
| Jobs report, 8:30 AM ET | 170 | 34 | $9,087 | 25 of 34 (73.5%) | -$2,588 |
| Total | 466 | 93 | $45,532 | 53 of 93 (57.0%) | -$5,268 |
Hypothetical backtest, releases on trading days only. Eight jobs reports and two CPI releases fell on exchange holidays or closed sessions, when the book does not trade, and are left out; our prop-firm guide uses the same 466.
On FOMC days, 20 of the 28 were morning Opening Range Break entries still open at the statement. Without the best of the 28, $9,932 on July 31, 2024, the other 27 netted a hypothetical $18,827.
On CPI and jobs days every trade held through the number was the Overnight strategy, which enters in the evening session and is still open at 8:30 AM, so its exit price includes the reaction. Those 65 trades netted a hypothetical $16,773 on 120 contracts. Slippage is the gap between expected and filled price; 28 ticks of extra slippage per contract on those exits, at $5 per tick, would erase the profit.
Entries right after a release are rare: none came within 30 minutes after a CPI or jobs release, and 7 came within 30 minutes after an FOMC statement, which lands mid-afternoon. Two of the 7 won, including the $38,823 VWAP Short; the 6 besides it netted a hypothetical -$5,483, with 1 winner.
What does this mean for you?
In this record, release days looked like ordinary days. What matters on those days is your account's rules.
- Personal account: the record gives no reason to skip or favour FOMC, CPI or jobs days.
- Funded account: check the firm's news rule, since some firms restrict holding or opening positions around major releases. On this record the positions to watch are the Overnight strategy on CPI and jobs mornings, morning entries on FOMC days and the occasional entry just after an FOMC statement. Our prop-firm guide tests three firms' rules against these trades; rules differ and change, so we do not restate them here.
- Any striking slice of a backtest, ours included: ask how many slices were checked before that one was found.
How we measured this
- Trades. The 3,500-trade backtest record of the five-strategy book. It reproduces our published headline figures exactly: $1,112,232 net, 3,500 trades, 45.5% win rate. Dollar figures are NQ mini, 1 to 3 contracts scaled by volatility, after $4.10 per contract round-trip commission and two ticks of slippage on market and stop fills; limit fills carry none.
- Window. August 11, 2011, the first trade, to August 5, 2026: 3,728 trading days on the strategy's own calendar. July 2026, after signals went live, is included at backtest fills.
- Release dates. From official archives: federalreserve.gov meeting calendars for FOMC statements, BLS release archives for CPI and jobs reports. Every CPI and jobs date matched the St. Louis Fed's ALFRED release list. Scheduled FOMC meetings only; the 2020 emergency moves are excluded, and the October 2025 CPI and jobs reports were never published.
- Release times. CPI and jobs reports at 8:30 AM ET. FOMC statements at 2:00 PM ET from March 2013, and at 12:30 or 2:15 PM ET before that.
- Clock. Trade times are New York time, confirmed against an independent NQ price record: 95.6% of 884 Trend entries matched within a point.
- Day assignment. A trade entered at or after 6:00 PM ET counts toward the next day's session.
- Chance. Every share of random sets is run ten times with different seeds and reported as its range across the ten runs.
Hypothetical Performance Disclaimer (CFTC Rule 4.41): These results are based on simulated or hypothetical performance results that have certain inherent limitations. Unlike the results shown in an actual performance record, these results do not represent actual trading. Also, because these trades have not actually been executed, these results may have under- or over-compensated for the impact, if any, of certain market factors, such as lack of liquidity. Simulated or hypothetical trading programs in general are also subject to the fact that they are designed with the benefit of hindsight. No representation is being made that any account will or is likely to achieve profits or losses similar to these being shown.
Past performance is not necessarily indicative of future results. Futures trading involves substantial risk of loss and is not suitable for all investors.
See what STS NQ futures signals are and how they reach you and our forward record, every live signal we have sent, dated and public.