Buy NQ Signals or Build Your Own? What 1,098 Backtests Say It Really Costs
Short answer. Build your own NQ system only if you enjoy the research: it costs tests and dead ends long before it costs a trade. In one two-week cycle we ran 1,098 full-history TradingView backtests on our own strategies, and none improved the book. STS sends the finished book's trades, from four strategies, for $50 a month.
The research runs below are our own, on NQ futures in TradingView. The book figures come from the hypothetical backtest of our four-strategy book: 3,139 trades from 2011 to 2026.
What does it take to build an NQ strategy yourself?
A backtest you can trust, and far more tests than ideas. From May 27 to June 9, 2026, we ran 1,098 backtests, each a full-history run in TradingView.
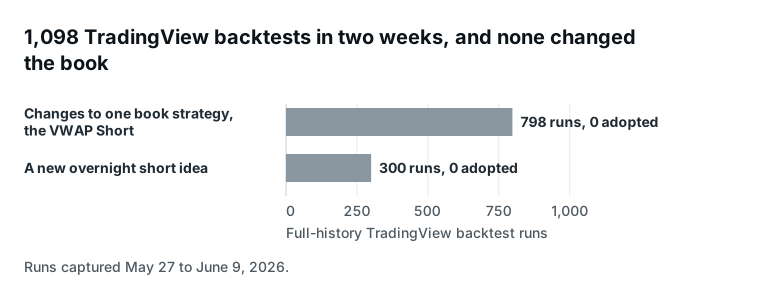
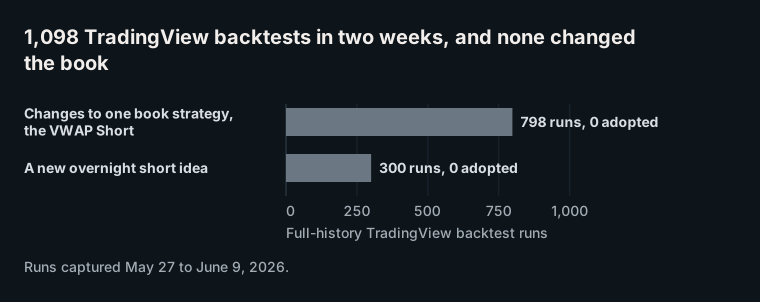
798 runs tested changes to the VWAP Short, one of the four strategies in the book: its stops, exit times, filters and sizing. None improved the book, so its production rules stayed.
The other 300 tested a new overnight short idea. It never joined the book.
Building the strategy code and the testing tools came before any of it.
Why do most backtests end up as dead ends?
Because many good-looking results are errors. A test that uses information it could not have had in real time finds winners that vanish in an engine you can trust.
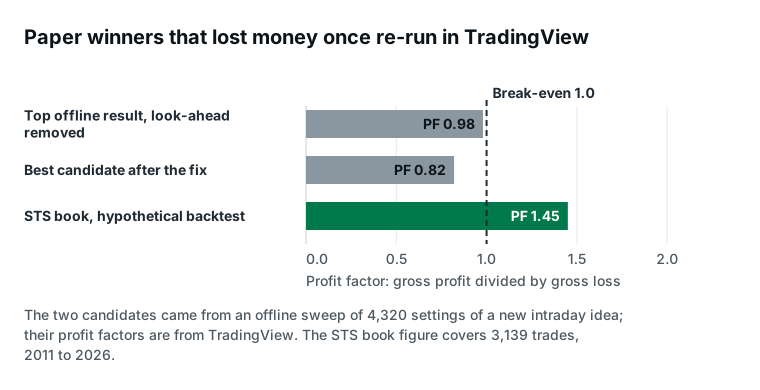
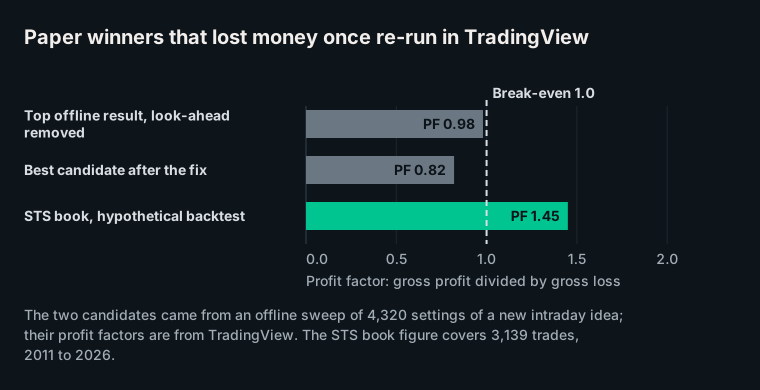
We swept 4,320 settings of a new intraday idea in a fast offline engine. Its standout results were all one look-ahead error: trades filled at the price from the start of a bar, using information from the end of it.
With the error fixed, we re-ran the top result in TradingView. Its profit factor, gross profit divided by gross loss, was 0.98. The best candidate after the fix scored 0.82. Below 1.0, a strategy loses more than it makes.
For scale, the four-strategy book's profit factor over 3,139 hypothetical backtest trades is 1.45. Our guide to checking a backtest for overfitting covers more of these traps.
Can a better strategy make your whole system worse?
Yes. A strategy that looks healthier on its own can make the full system weaker, and you only see it by testing inside the whole book.
We took 3 versions of the VWAP Short that scored better on their own and swapped each into the full book, as it stood then, in TradingView. All 3 earned less and drew down deeper inside the book than the version already there.
The reason is the book's design. It holds one position at a time across several strategies, so the VWAP Short's job is to add profit in conditions the others miss. In the clearest case, a filter that made it look smoother alone removed trades the book needed.
What do you get when you buy instead?
A finished, tested book, delivered as alerts you act on. Four strategies trade NQ as one book that holds one position at a time.
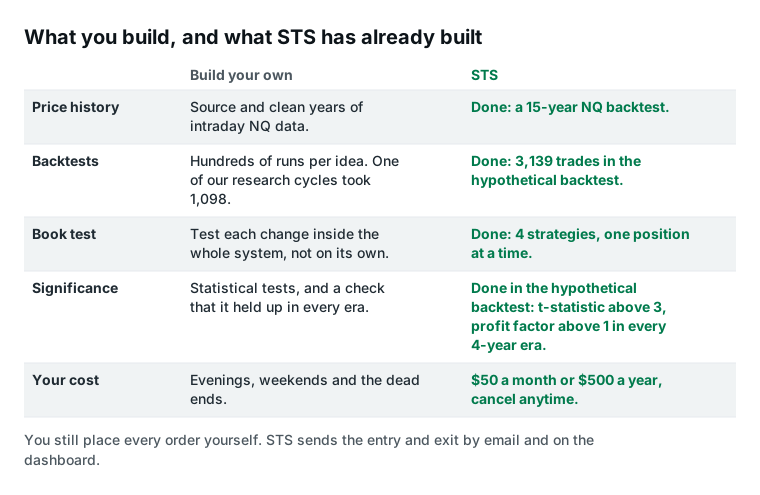
Over its 15-year hypothetical backtest of 3,139 trades, the book's average trade clears a t-statistic of 3, the bar for an edge that is unlikely to be luck. Its profit factor is above 1 in each of four 4-year eras, from 1.05 in 2011 to 2014 up to 1.73 in 2023 to 2026. The full record is on the tear sheet.
Each entry and exit reaches you by email and on the dashboard's live feed. The entry gives direction, contract count, price and time in ET; the exit adds the entry price, exit price and duration. You place your own orders, so there is no broker connection and no bot.
How we measured this
- Research runs: every TradingView strategy report we captured between May 27 and June 9, 2026: 1,098 backtest runs, not counting one setup check, all on the book as it stood then. Run time is the median gap between consecutive captures.
- Look-ahead example: profit factors are TradingView's. The offline engine's own figures are not quoted, because offline fills are not results we publish.
- Book swap test: the full book as it stood in late May 2026, in TradingView, with only the VWAP Short changed, same costs and sizing.
- Book: our backtest of the four-strategy NQ book, data as of November 6, 2026: 3,139 trades from 2011 to 2026, NQ mini, 1 or 2 contracts a trade (2 when daily ranges are small, 1 when they are large; every trade since July 2024 has been 1 contract), commissions and slippage included. The t-statistic is on each trade's percentage return; eras are calendar years 2011 to 2014, 2015 to 2018, 2019 to 2022 and 2023 to 2026. All book figures are hypothetical.
What this means for you
If you enjoy the research, building is a real path. Budget for many runs per idea, and re-run every winner inside the whole system, in an engine you trust. Our notes on how to build a profitable NQ strategy are a starting point.
If you want the finished book without the dead ends, STS is $50 a month or $500 a year, and you can cancel anytime in Settings. See the plans.
We trade this book live and sell access to the signals, so judge the data accordingly. This article is educational and is not investment advice. Futures trading involves substantial risk of loss and is not suitable for every investor.
Hypothetical Performance Disclaimer (CFTC Rule 4.41): These results are based on simulated or hypothetical performance results that have certain inherent limitations. Unlike the results shown in an actual performance record, these results do not represent actual trading. Also, because these trades have not actually been executed, these results may have under- or over-compensated for the impact, if any, of certain market factors, such as lack of liquidity. Simulated or hypothetical trading programs in general are also subject to the fact that they are designed with the benefit of hindsight. No representation is being made that any account will or is likely to achieve profits or losses similar to these being shown.
Past performance is not necessarily indicative of future results. Futures trading involves substantial risk of loss and is not suitable for all investors.
See what STS NQ futures signals are and how they reach you and our forward record, every live signal we have sent, dated and public.