TopStep vs Apex vs MyFundedFutures: the rule differences that change how you size
We ran the STS NQ book, a real 15-year, 3,505-trade live-traded portfolio, through the $50,000 rules of TopStep, Apex, and MyFundedFutures at one micro per signal. Same trades, three rulebooks. Only one account busts: MyFundedFutures Core, and it dies at trade #517 on 2013-08-12. Every other $50k rule set survives the exact same trades.
The reason is not the headline drawdown number. It is that MyFundedFutures Core gives $1,500 of room instead of $2,000. That single $500 is the whole difference between a busted account and a live one, on identical fills.
Then we sized up. At three micros the order flips. The intraday-ratchet floors, the ones that count your open unrealized profit against you, and the tight Core floor all fail 34 trades sooner than the plain end-of-day $2,000 floors. So the "harshest" firm changes with your size. That is the point of this article: three rules, not the advertised drawdown, decide which account breaks first.
We are not affiliated with TopStep, Apex Trader Funding, or MyFundedFutures. This is rule-difference analysis, not a ranking of which firm is best. Every rule below is dated to a 2026-07-03 capture, and prop rules change without notice. Verify each firm's own page on the day you sign up.
Whose trades are these (read this before using our numbers)
Everything below runs on our own book: five systematic NQ strategies traded as one single-position portfolio. TradingView backtests, June 2011 to June 2026, one to three volatility-scaled contracts, commissions and slippage included, $1,120,402 net across 3,505 trades. The entries are momentum and trend continuation, intraday plus one overnight model. Not mean reversion, not scalping.
A signal-follower on a $50k eval would not trade our full mini size. They would trade micros. So we scale the book down to micros: one micro per signal is the base case, two and three micros are the sized-up cases. One micro is one-tenth of the backtested mini size.
The style shapes every number here. A momentum book takes long losing streaks between big winners, and those streaks are exactly what a trailing floor hunts. Your own strategy has its own drawdown shape, and every result below scales with it. What transfers to any trader is the method: take your real trade history, run it through each firm's floor rule, and find which rule breaks you first. Our exact bust trades do not transfer. The procedure does.
The three rules that actually decide your account
Forget the marketing page for a second. On a $50k eval, three rule dimensions move the outcome, and none of them is the big drawdown headline.
The first is the floor ratchet basis. Does the trailing floor rise on your end-of-day balance, or on your intraday peak including open unrealized profit? An end-of-day floor only ratchets up after the session closes. An intraday floor ratchets up the instant an open trade prints a new high, then holds there even if you give the profit back. That second kind punishes round-trips.
The second is whether a daily loss limit exists at all. TopStep has none beyond the max loss limit. Apex EOD carries a $1,000 daily loss limit that pauses your day. MyFundedFutures has removed daily loss limits on every plan. A daily loss limit caps how much one bad session can cost you, separate from the trailing floor.
The third is the buffer in dollars, not percent. "3%" sounds gentle next to "$2,000". On a $50k account, 3% is $1,500. That is a smaller cushion, and on this book the missing $500 is what busts the account.
Here is the full $50k rule set, all captured 2026-07-03.
| Firm / product | Drawdown $ (50k) | Floor ratchets on | Unrealized gain moves floor | Daily loss limit | Best-day cap |
|---|---|---|---|---|---|
| TopStep Combine | $2,000 | End-of-day balance | No | None beyond MLL | 50% ($1,500) |
| Apex EOD Trailing | $2,000 | End-of-day close (4:59 ET) | No | $1,000 (pauses day) | 50% |
| Apex Intraday Trailing | $2,000 | Intraday peak, real time | Yes | None | 50% |
| MyFundedFutures Core | $1,500 (3%) | End-of-day close | No | None | 50% (eval) |
| MyFundedFutures Rapid | $2,000 (4%) | Intraday peak, real time | Yes | None | None |
Read across it and the firms stop looking alike. TopStep and Apex EOD have the identical floor: $2,000, ratchets end-of-day, locks at the $50,000 start. On our book they behave as one account. The two intraday floors, Apex Intraday and MFFU Rapid, share the other mechanic. MFFU Core sits alone with the tight $1,500 buffer.
At one micro, only the $1,500 floor breaks, at trade #517
We funded a fresh $50,000 account at the very first trade in 2011 and ran the whole 3,505-trade sequence forward once through each rule set. At one micro, four of the five survive all fifteen years. MFFU Core busts.
| Firm / product | Outcome at 1 micro | First breach |
|---|---|---|
| TopStep MLL | Survived | none |
| Apex EOD | Survived | none |
| Apex Intraday | Survived | none |
| MyFundedFutures Core | Bust | trade #517, 2013-08-12 |
| MyFundedFutures Rapid | Survived | none |
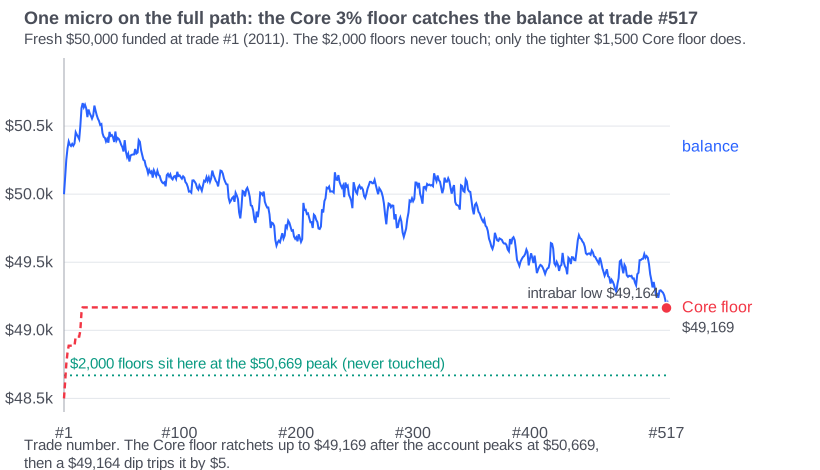
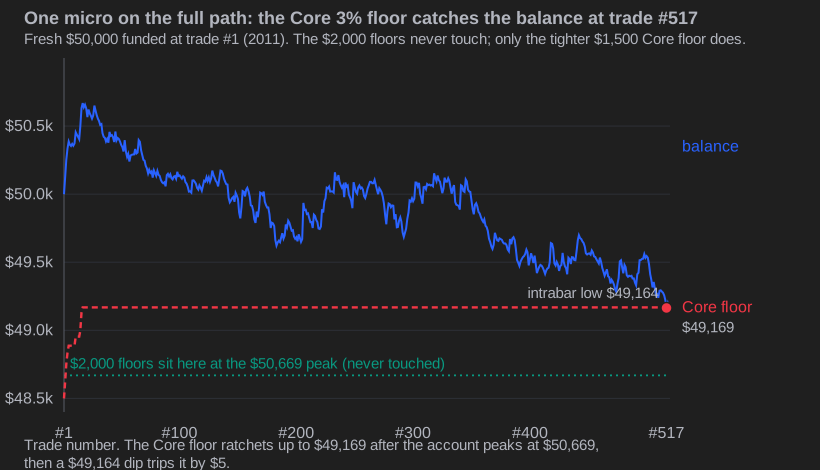
The breach is worth walking through, because it shows how close it is. By trade #517 the account had peaked at a balance of $50,669. The Core floor trails 3% below the peak, so it had ratcheted up to $49,169. On 2013-08-12 an open trade dipped to an intrabar low of $49,164. That is $5 under the floor. The account is gone.
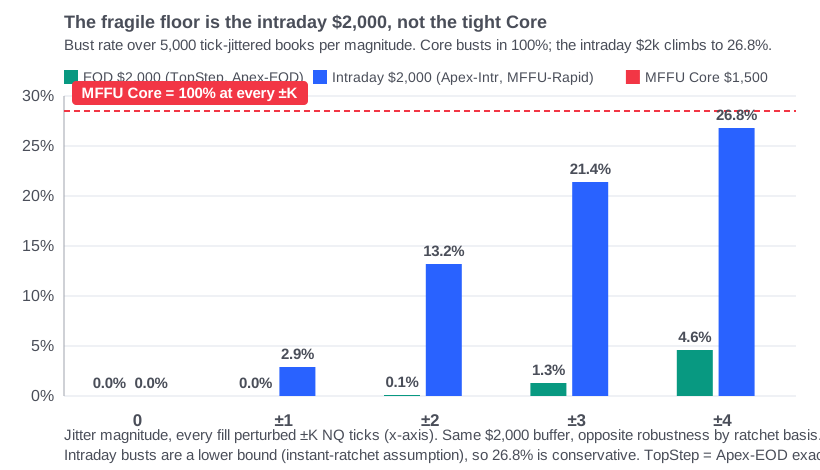
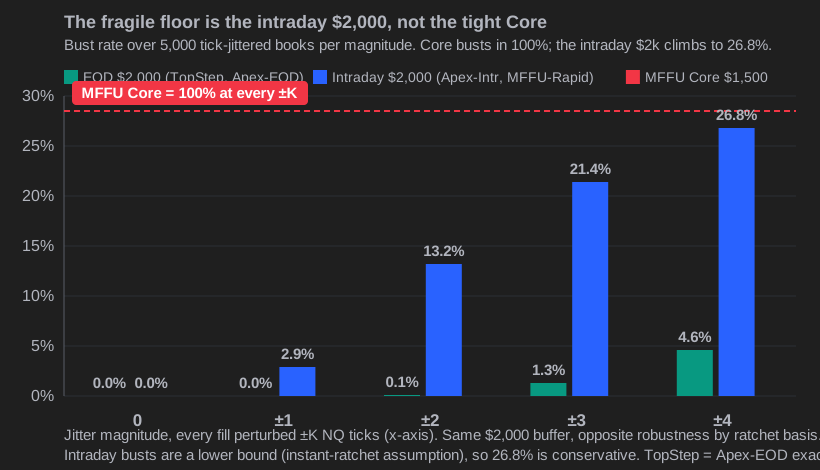
Be honest about that $5. On this exact bar it is inside the model's noise, so we tested whether the bust is just one lucky fill. We jittered every entry and exit in the whole book by up to four ticks and re-ran the account 5,000 times at each magnitude. The Core account still busts in 100% of those 5,000 jittered books, at every wobble from one tick to four. The exact trade moves, but the account dies every time. The $5 dip reads fragile. The bust it triggers is not. What is fragile is the intraday $2,000 floor, which we come back to at the end.
So the $1,500 buffer does not decide which trade dies, but it does decide that the account dies. The $2,000 floors sat at $48,669 at that same peak, a full $505 lower, and this dip never came within $300 of them. That extra room is the margin that keeps a normal drawdown from touching the floor at all.
This all happens inside the book's only losing stretch of 2013, a year the whole book lost just $778. The account was up $669 on the peak and barely red on the year. It still failed, because the floor does not care about the year. It cares about the dip from the high, and $1,500 of room could not absorb this one.
Size up and the order flips
One micro is a single path, and a single path can be luck. So we sized the same book up. At two and three micros, every account busts. Watch the order, because the harshest rule changes as you size.
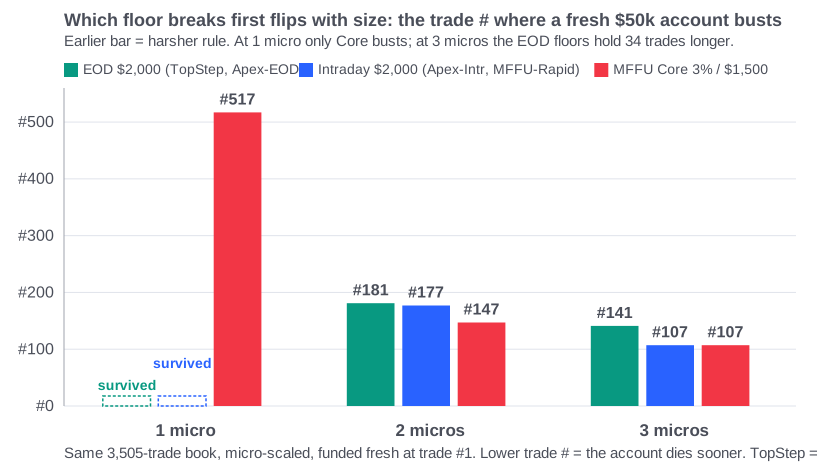
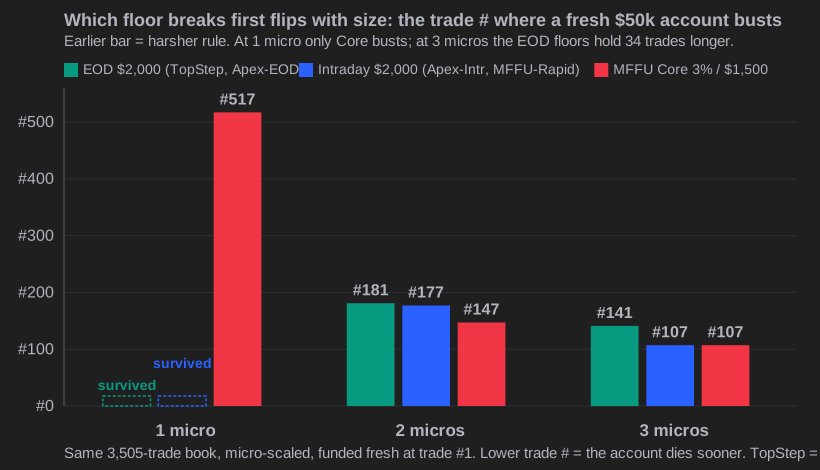
At two micros the tight Core floor fails first, at trade #147 on 2012-03-01. The two intraday floors fail next, together, at trade #177. The two end-of-day $2,000 floors fail last, at trade #181. So the ranking from harshest to gentlest is Core, then intraday, then end-of-day.
At three micros the intraday floors catch up to Core. Apex Intraday, MFFU Rapid, and MFFU Core all bust together at trade #107 on 2012-01-11. The plain end-of-day $2,000 floors, TopStep and Apex EOD, hold 34 trades longer on this single path, to trade #141. That exact 34 is one number from one funding date; across all 2,545 start dates the same gap shows up as a median 26 trades to bust on the end-of-day floors against 23 on the intraday floors. At heavier size, giving back open profit is what kills you fastest, and that is exactly what the intraday floors punish.
| Size | Harshest (earliest bust) | Then | Gentlest (latest bust) |
|---|---|---|---|
| 1 micro | MFFU Core, #517 | others survive | TopStep = Apex EOD, survive |
| 2 micros | MFFU Core, #147 | Apex Intraday = MFFU Rapid, #177 | TopStep = Apex EOD, #181 |
| 3 micros | Apex Intraday = Core = Rapid, #107 | TopStep = Apex EOD, #141 |
The takeaway is not "pick firm X". It is that the rule that breaks you depends on your size. At light size the dollar buffer is everything, so the $1,500 floor is the trap. At heavy size the ratchet basis takes over, so the intraday floors become the trap. Same book, opposite answer.
The sub that breaks you flips with the floor type
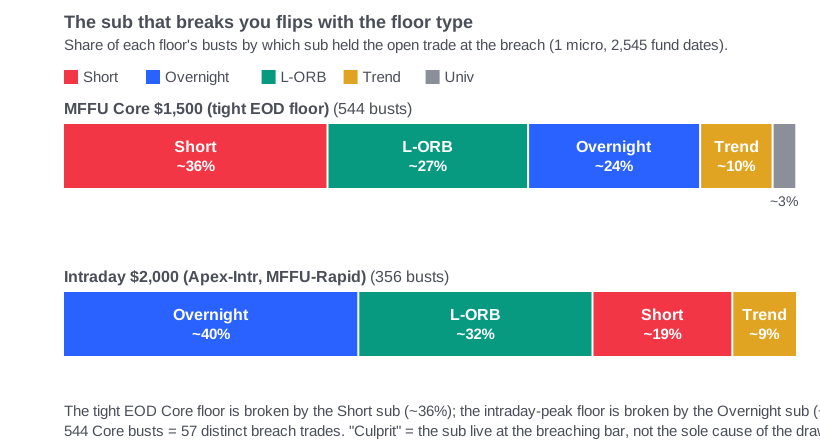
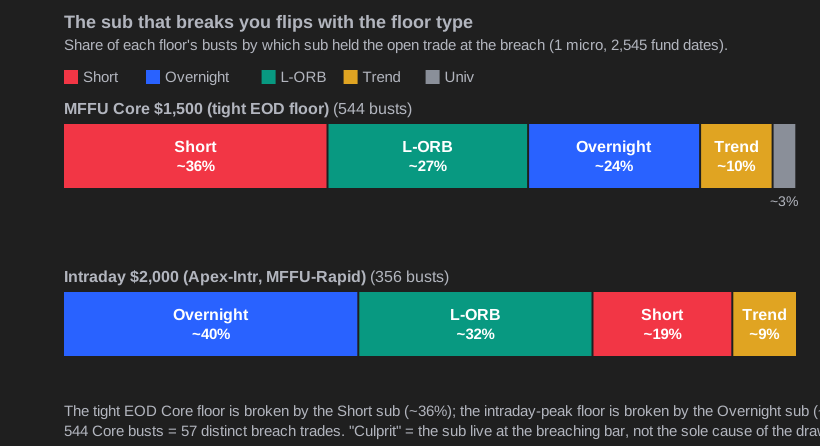
There is a mechanical reason the ordering flips, and it is the one thing only we can show, because it needs the trade-by-trade attribution behind the book. Our five strategies are not interchangeable. When we tag every busted account by which sub held the open position at the breaching bar, a clean split falls out, and the culprit changes with the floor.
On the tight Core floor, the sub live at the breach most often is the countertrend Short, about 36% of Core busts, ahead of L-ORB near 27% and the overnight model near 24%. A countertrend short's worst adverse move sits closest to a tight buffer, so the $1,500 room runs out under a short first. Switch to the intraday-ratchet floor and the order reshuffles: now the overnight model breaks it most, about 40% of those busts, then L-ORB near 32%, with the Short down near 19%. An overnight position gives back open gap profit, and giving back open profit is exactly what an intraday-peak floor punishes. Different floor, different sub, same book. Read the ordering as directional, not the decimals as precise: those 544 Core busts trace to 57 distinct breach trades across overlapping start dates, so a handful of shared episodes carry each share.
One path is an anecdote, so we tested 2,545 of them
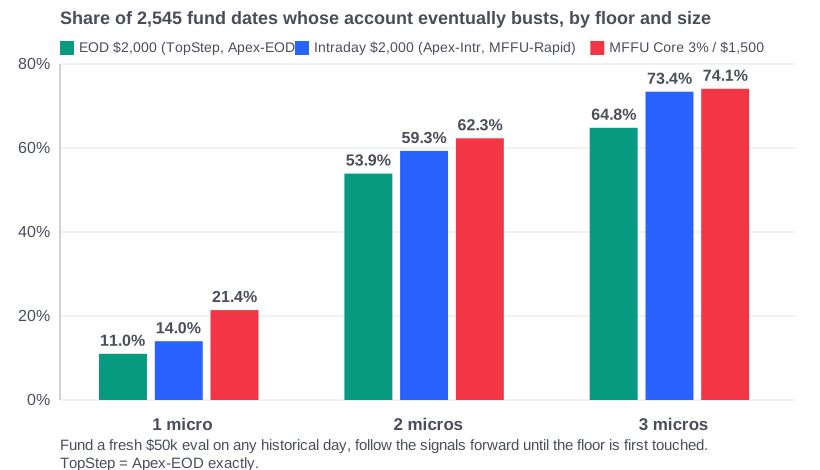
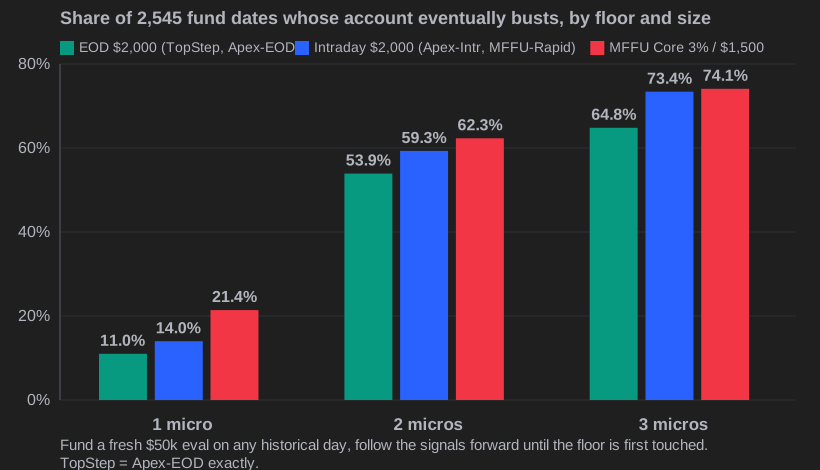
Funding at trade #1 is one story. So we ran 2,545 of them. We funded a fresh account on every historical trading day in the book and ran each one forward until its floor was first touched. That removes single-start luck and isolates the rule. This is not a pass-rate, since there is no profit target here. It is the share of start dates whose account eventually busts.
The ordering from the single path holds across all 2,545 starts, and it holds at every size. TopStep and Apex EOD are identical to the trade. The intraday floors bust more start dates than their end-of-day twins. The tight Core floor busts the most.
| Rule (all $50k) | 1 micro | 2 micros | 3 micros |
|---|---|---|---|
| EOD $2,000 (TopStep, Apex EOD) | 11.0% | 53.9% | 64.8% |
| Intraday $2,000 (Apex Intr, MFFU Rapid) | 14.0% | 59.3% | 73.4% |
| MFFU Core 3% / $1,500 | 21.4% | 62.3% | 74.1% |
These rates are not an artifact of one trade ordering. We re-drew the whole history 1,000 times with a moving-block bootstrap that keeps the losing streaks intact, and even in the worst 2.5% of those resamples the Core floor still busts at least 19.4% of fund dates and the intraday floor at least 13.5%, both above the end-of-day floor's 11.0% point estimate. The ordering holds when the trades are re-sequenced, not just on the one path history handed us.
The intraday floors do not just bust more accounts. They kill faster. At one micro they bust a fresh account in a median of 29 trades, against 36 for the end-of-day twin with the identical $2,000 buffer. Counting your open profit against you shortens the account's life even when the buffer is the same size.
An intraday-ratchet floor punishes giving back open profit, so on those accounts size for the peak you touch, not the profit you keep. On end-of-day floors, only the close matters. And the dollar buffer, not the percent, is what a normal dip has to fit inside.
The consistency cap is not what breaks this book
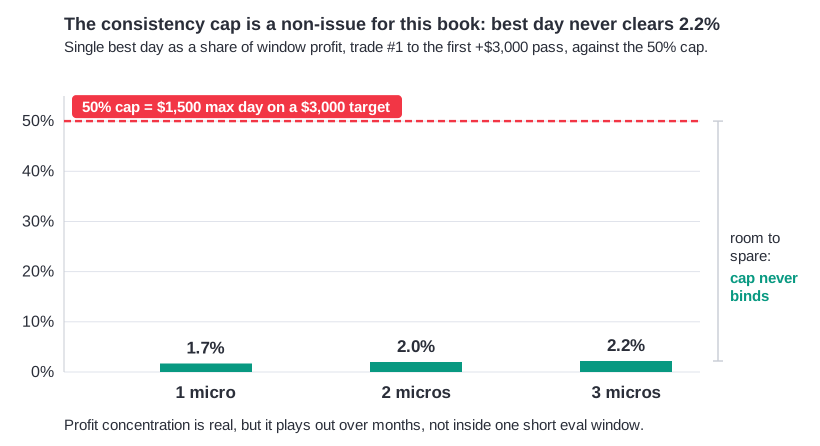
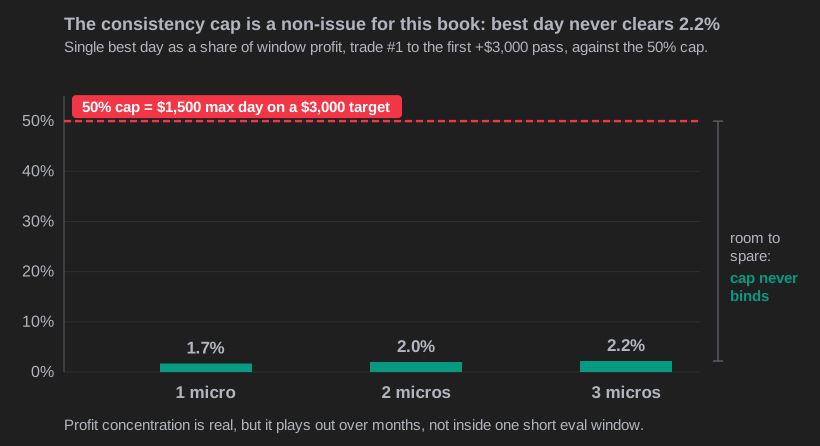
Every one of these firms has a consistency rule: your single best day cannot exceed 50% of the profit target, which is $1,500 on a $3,000 target. A momentum book that concentrates profit in a few huge days could collide with that. Ours does not, at least not inside an eval window.
We ran the account from trade #1 until it first banked $3,000, then measured the single best day's share of the profit over that window. At one micro the best day was 1.7% of the window's positive-day profit. At two micros, 2.0%. At three, 2.2%. All far under the 50% cap. Our profit concentration is real, but it plays out over months and years, not inside one quick pass, so the eval window is too short for the tail to show up. For this book the consistency cap is a non-issue and the drawdown floor is the whole game. Yours may differ if your edge lives in a handful of outlier days.
There is one firm difference worth naming even though it did not bind here. At TopStep and Apex, breaching the consistency cap blocks your payout until you trade it back down. At MyFundedFutures the cap does not fail the account, you just trade more days until you meet it. Same 50% number, different consequence.
A checklist you can run on any firm before you size
You do not need our data to do this. Before you fund any eval, read the rulebook for these five things, in this order, because they decide your sizing more than the advertised drawdown does.
- Is the trailing floor end-of-day or intraday? End-of-day only ratchets up after the close. Intraday ratchets the instant an open trade prints a high.
- Does unrealized profit move the floor? If yes, giving back open profit can bust you even on a green day.
- Is there a daily loss limit? If yes, one bad session is capped. If no, only the trailing floor stands between you and a bust.
- What is the buffer in dollars, not percent? Convert every "3%" and "4%" to a dollar figure at your account size, then compare like for like.
- What is the consistency cap, and does breaching it fail you or just delay payout? A concentrated book cares. A steady one may not.
Then the one-line sizing rule. On an intraday-ratchet floor, size for the highest equity you touch during a trade, not the profit you actually keep, because the floor locks in at your peak. On an end-of-day floor, only the closing balance ratchets the floor, so intraday give-back is forgiven. Same book, and the safe size is different on each.
If you want the deeper mechanics behind these numbers, we showed why a profitable strategy still fails the trailing floor, why you should expect a worse drawdown live than your backtest showed since that gap is what a floor hunts, and why a signal-follower sizes in micros not minis on a $50k eval. The book every one of these sims runs on is on the strategy page.
How we measured this
Instrument: CME E-mini Nasdaq-100 (NQ), micro-scaled. Data: the TradingView list-of-trades export from our live five-strategy book, 2011-06-26 through 2026-06-17, 3,505 trades, $1,120,402 net, commissions and slippage included in the backtest. Account: $50,000 evaluation tier for all three firms, chosen so the contrast is same-size. Sizing: one micro per signal is one-tenth of the backtested mini size, and two and three micros scale from there. Every account starts fresh at $50,000.
Floor model. For each firm we set the drawdown distance, the ratchet basis, and the lock level from the 2026-07-03 rule captures. End-of-day floors ratchet up on the session's closing balance. Intraday floors ratchet up on the intraday peak including open unrealized profit. For all firms the breach is checked intraday, on the worst intrabar equity of each trade. We reconstruct the intraday peak from each trade's favorable excursion. The book holds one position at a time, so that excursion is the position's intraday high.
Verification. Every load-bearing number was computed two independent ways: one script sharing the parse and floor logic, and a second script written from scratch with a separate exit-row parse and its own floor control flow. They agree exactly on all fifteen breach trades and the rolling-start bust rates. The trade-#517 breach was also hand-walked from the raw CSV: peak balance $50,669, floor $49,169, intrabar low $49,164.
Three later analyses were added on the same book and held to the same two-way standard. The culprit-sub split tags each busted account by the sub holding the open position at the breaching bar, and the sub map reconciles to the canonical per-sub trade and profit split to the cent before any tagging is read. The tick-jitter test perturbs every entry and exit fill by up to four ticks and re-runs the account 5,000 times per magnitude, with the zero-jitter case reproducing the exact #517 bust as a control. The robustness band on the bust rates is a moving-block bootstrap, 1,000 resamples with a block length above the longest losing streak so streak clustering is preserved, and its point estimate on the actual order reproduces 11.0% / 14.0% / 21.4% before any resample. We publish the historical point estimates as the headline and cite the bootstrap only as a worst-2.5% band, never as the bust rate itself.
Where this analysis stops, and two honest limits
First, the intraday-floor busts are a lower bound. We assume the floor ratchets up the instant an open trade prints a new high, which overstates the peak and over-counts intraday busts. So the true gap between intraday and end-of-day floors is at least what we show, probably a touch smaller. We would rather overstate the intraday harshness than hide it.
That same intraday floor is the fragile one, and it is worth seeing why the fragility sits there and not on Core. When we jitter every fill by up to four ticks and re-run the book 5,000 times per magnitude, the end-of-day $2,000 floor barely moves, from 0% up to 4.6% of fund dates busting even at a four-tick wobble. The intraday $2,000 floor, with the identical $2,000 buffer, climbs from 0% to 26.8%. It survived the actual path, but a few ticks of fill noise is enough to break it a quarter of the time. Same buffer, opposite robustness, and the only difference is whether the floor ratchets on the intraday peak. The Core floor, by contrast, busts in 100% of every jittered book, so its bust is the robust one and the intraday floor is where the knife-edge really lives.
Second, this is a what-if on TradingView's exported trades, not an in-engine backtest of a strategy change. TradingView is the engine truth for the trades themselves. Our floor sim is an approximation layered on top of real fills. It cannot capture within-bar sequencing, so a real floor could trip on a wick this method never sees.
And the rules move. Every figure here is dated 2026-07-03. Apex 4.0 took effect 2026-03-01, and the daily-loss-limit and lock-level details for the intraday products came from corroborating sources rather than a single clean primary page. Prop firms change their rulebooks without notice. Re-check each firm's own page before you act on any of this.
Here is what we would run next, and what you can run now. Take your own trade history, not ours, and push it through each firm's floor the way we did. Our book is a momentum book with long dry streaks, so the tight buffer bites it early. A mean-reversion book with shallow, frequent dips would feel the intraday ratchet more and the $1,500 buffer less. The rule that breaks you is not fixed by the firm. It is set by where your own drawdowns land against each floor's basis and buffer. The firm's marketing tells you the drawdown number. Your trade history tells you which rule actually decides the account.
The full distribution work behind these numbers lives in our strategy research and the live-tracked tear sheet. If you want the signals that generated the trade list we ran through every firm's floor, that is the one thing we sell.
STS Research. Educational content, not investment advice. We trade this book live and sell access to its signals, so judge the data accordingly. We are not affiliated with TopStep, Apex Trader Funding, MyFundedFutures, or any prop firm. All rule figures were captured 2026-07-03 and change without notice.
CFTC Rule 4.41: Hypothetical or simulated performance results have certain limitations. Unlike an actual performance record, simulated results do not represent actual trading. Also, since the trades have not been executed, the results may have under- or over-compensated for the impact, if any, of certain market factors, such as lack of liquidity. Simulated trading programs in general are also subject to the fact that they are designed with the benefit of hindsight. No representation is being made that any account will or is likely to achieve profit or losses similar to those shown.
Past performance is not indicative of future results.