Daily Loss Limit: STS's One-Position NQ Signals Never Lost $1,000 in a Backtest Day at 1 or 2 MNQ
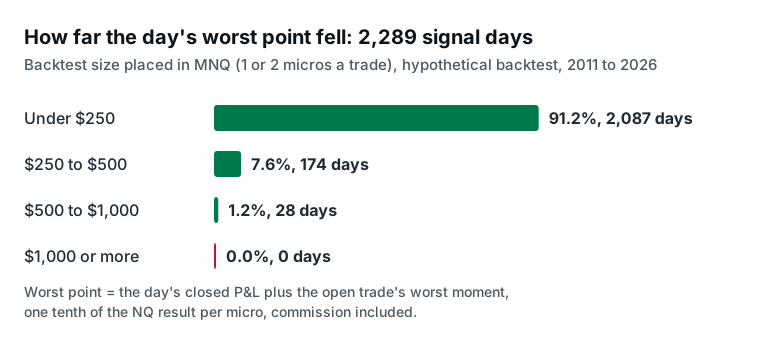
Short answer. In our hypothetical 2011 to 2026 backtest, STS's NQ signals taken at the backtest's own size, 1 or 2 MNQ a trade, stayed inside a $1,000 daily loss limit on all 2,289 signal days, the days with at least one closed trade. The deepest any day fell at its worst point was $881, and the median day's worst point was $66 down. The book holds one position at a time, so losses never stack across open trades.
These are the backtested trades of our four systematic NQ strategies, which share one position, restated in MNQ micro contracts, each one tenth of an NQ contract. They are momentum and trend trades, intraday plus one overnight strategy, not scalps. The method carries over to any trader: judge a day by its worst point, not its close.
What is a daily loss limit, and why does it matter?
It is a hard stop for one day: once you are down a set amount, you stop trading until tomorrow. You can set one on any account, and prop firms build the same idea into theirs.
A limit only helps if your normal bad day sits well inside it. So we measured each backtested day at its worst moment: the day's closed result so far plus the open trade's deepest dip.
How often would STS signals have hit a $1,000 daily loss limit?
Never in our backtest, at its own size of 1 or 2 MNQ a trade. Across 2,289 signal days, no day's worst point reached $1,000, and 98.8% of signal days stayed inside $500.
| Size per trade | Inside $500 | Inside $1,000 | Inside $2,000 |
|---|---|---|---|
| 1 MNQ every trade | 2,274 | 2,289 | 2,289 |
| Backtest size in MNQ (1 or 2) | 2,261 | 2,289 | 2,289 |
| 2 MNQ every trade | 2,177 | 2,274 | 2,289 |
Signal days whose worst point stayed inside each daily loss limit, of 2,289. Hypothetical backtest.
It held in every calendar year, including 2026 through November 6, when all 121 backtested signal days stayed inside $1,000.
Costs are not doing the work. Charging every micro the full $4.10 round-turn commission of an NQ contract, still no day reached $1,000; the deepest fell $910.
Size sets the limit you need. Placed as full NQ contracts at the same 1 or 2, every dollar figure is about ten times larger: the deepest day fell $8,807, so a $10,000 daily limit plays the role $1,000 plays in micros. NQ vs MNQ explains the one-tenth relationship.
Why does one position at a time keep the day small?
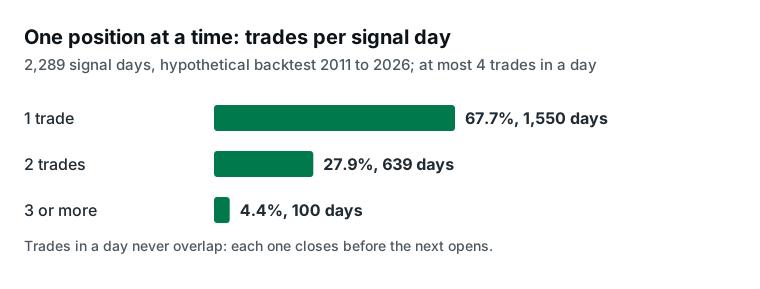
Because trades never overlap. Each one closes before the next opens, so a day's worst point is one open trade's dip plus whatever closed earlier that day. On 67.7% of backtested signal days the book took a single trade, and it never took more than four.
A book that holds several positions can lose on all of them at once; this one cannot. Your exposure at any moment is the single trade in front of you, and that is the exposure a daily limit caps. For how often signals arrive across a week, see how often our NQ signals fire.
How did we measure this?
We used the 3,139 hypothetical trades of the four-strategy book, a TradingView backtest of CME NQ futures from 2011 to 2026, with data as of November 6, 2026. The backtest trades the NQ mini, 1 or 2 contracts a trade (2 when daily ranges are small, 1 when they are large; every trade since July 2024 has been 1 contract). For micros, each trade's NQ result per contract, commission included, was cut to one tenth and multiplied by the same 1 or 2.
A day runs from 6 p.m. to 5 p.m. ET, the CME trading day. A signal day is one on which the book closed at least one trade: 2,289 of the 3,908 weekdays in the record. Days with no trade cannot touch a limit, so leaving them out makes every percentage here stricter.
A day's worst point is its closed P&L so far plus the open trade's largest adverse move in the backtest, with that trade's commission charged up front. Fills worse than the backtest's, or a larger size, would raise these numbers.
What this means for you
If you take each signal in micros at the backtest's own size, 1 or 2 MNQ, a $1,000 daily limit would never have stopped you in our backtest, and a $500 limit would have stopped you on 1.2% of signal days. That rate has risen with the index: in 2026 a $500 limit stopped 7 of 121 signal days (5.8%), and the worst day reached $795.
A daily limit caps one day, not a run of days. At the same size, the book's deepest drawdown, its largest fall from a peak, was $2,534 on closed trades and $2,852 counting open trades, in a drop that began August 4, 2026 and was still open on November 6, 2026. Size your account for the drawdown and your daily limit for the day.
Each entry and exit arrives by email and on the dashboard, and you place your own orders. STS signals cost $50 a month or $500 a year, and you can cancel anytime. See the plans.
We trade this book live and sell access to the signals, so judge the data accordingly. This article is educational and is not investment advice. Futures trading involves substantial risk of loss and is not suitable for every investor.
Hypothetical Performance Disclaimer (CFTC Rule 4.41): These results are based on simulated or hypothetical performance results that have certain inherent limitations. Unlike the results shown in an actual performance record, these results do not represent actual trading. Also, because these trades have not actually been executed, these results may have under- or over-compensated for the impact, if any, of certain market factors, such as lack of liquidity. Simulated or hypothetical trading programs in general are also subject to the fact that they are designed with the benefit of hindsight. No representation is being made that any account will or is likely to achieve profits or losses similar to these being shown.
Past performance is not necessarily indicative of future results. Futures trading involves substantial risk of loss and is not suitable for all investors.
See what STS NQ futures signals are and how they reach you and our forward record, every live signal we have sent, dated and public.