A Tour of the STS Dashboard: Live NQ Alerts First, Every Trade a Click Away
Short answer. You land on the Overview, open at its Today tab, and the first two panels are the ones you act on: Current Positions, what the book holds now, and Recent Alerts, every entry and exit as it arrives. Every trade in the record is one click away in the Trade Log, and the drawdown and performance views sit on the Overview's other tabs.
The member dashboard has four pages in its sidebar: Home, Overview, Trade Log and Settings.
What is the first thing I see after I log in?
The Overview, on its Today tab. A strip across the top gives five readings at a glance: Market, Position, Last signal, Today and Stats as of.
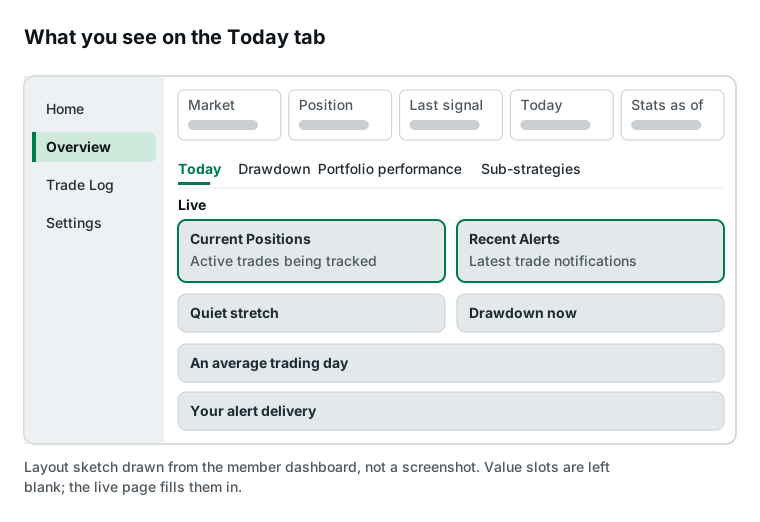
Below the strip sit four tabs: Today, Drawdown, Portfolio performance and Sub-strategies. On a phone, the sidebar folds behind a menu button and the panels stack in one column.
A range selector sets how much history the charts cover, from six months to the full record. It opens on the year to date.
Where do I see a new signal?
At the top of the Today tab, under Live. Current Positions shows the open trade with its direction, entry price, contract count and entry time in ET. Recent Alerts lists the latest entries and exits, each tagged with the strategy that fired.
The same alert reaches you by email from alerts@stsfutures.com, and browser push is optional. You place the order yourself in your own platform; nothing is placed for you.
The cards below answer the questions a quiet day raises. Quiet stretch shows where the current gap between signals sits against every gap in the record; how often NQ signals fire covers the usual gaps. Drawdown now shows how far the book sits below its last high.
An average trading day restates the record per day: the average result per active day and per trade, the average win and loss, and the time in a trade. Your alert delivery shows what we sent you and when, timed from the moment the signal reached us, so you can check that an alert went out.
Where do I check the full record?
On the other three Overview tabs and the Trade Log.
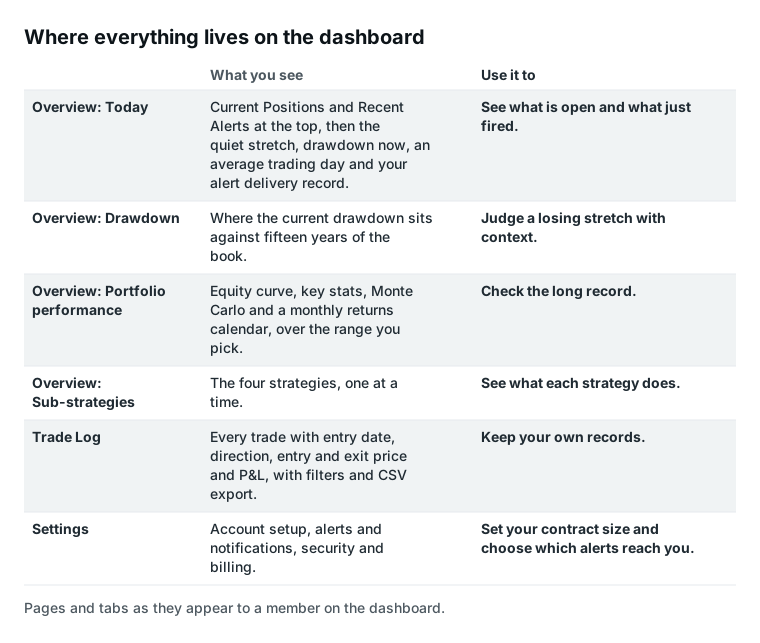
Portfolio performance holds the equity curve, an underwater curve that shows each drop below the last high, the key stats and a monthly returns calendar. The key stats include total return, max drawdown, win rate and profit factor, plus risk ratios such as Sharpe. A Monte Carlo card builds simulated years from trades drawn at random from the book's recent history.
Drawdown opens with an "Is this normal?" card that sets the current drawdown against the book's own history. Tail stats, hold-time and sizing profiles, and a heatmap of how the strategies move together sit below it. For how long past drawdowns lasted, see how long drawdowns last.
Sub-strategies shows the book's four strategies one at a time, so you can see what each one contributes.
Trade Log lists every trade with its entry date, direction, entry price, exit price and P&L. Filter it by direction or date, then export the filtered rows as a CSV file for your own records.
Can I set the dashboard up for my own account?
Yes. In Settings, the trading profile under Account setup takes your starting capital and a contract size, micro or mini, and the dashboard scales every P&L figure to them. One micro contract is one tenth of a mini.
Alerts and notifications lets you switch entry alerts or exit alerts on or off, turn on push to the device you are using, and send alerts to a different email address. Security and Billing sit on the same page.
How we described it
- Source: the member dashboard, November 2026. Labels in this article and in both sketches are the dashboard's own wording.
- Sketches, not screenshots: the two figures are drawn diagrams. Value slots are left blank, so they show no prices, positions or results.
- What varies: panel contents change with the market and with your settings.
What this means for you
The screen you land on answers the question that matters on a trading day, whether anything is open or just fired, before it shows you anything else. Everything else is a tab away when you want it.
The dashboard comes with every STS plan: $50 a month or $500 a year, and you can cancel anytime in Settings. See the plans.
We trade this book live and sell access to the signals, so judge the data accordingly. This article is educational and is not investment advice. Futures trading involves substantial risk of loss and is not suitable for every investor.
Hypothetical Performance Disclaimer (CFTC Rule 4.41): These results are based on simulated or hypothetical performance results that have certain inherent limitations. Unlike the results shown in an actual performance record, these results do not represent actual trading. Also, because these trades have not actually been executed, these results may have under- or over-compensated for the impact, if any, of certain market factors, such as lack of liquidity. Simulated or hypothetical trading programs in general are also subject to the fact that they are designed with the benefit of hindsight. No representation is being made that any account will or is likely to achieve profits or losses similar to these being shown.
Past performance is not necessarily indicative of future results. Futures trading involves substantial risk of loss and is not suitable for all investors.
See what STS NQ futures signals are and how they reach you and our forward record, every live signal we have sent, dated and public.