A Few Planned NQ Trades a Week, One at a Time: STS Signals for Day Traders Prone to Overtrading
Short answer. STS's NQ book took one trade or none on 81.1% of weekdays across 15 years of hypothetical backtest, averaged 4.02 trades a week and held one position at a time. Its winners averaged 1.74 times the size of its losers, while 45.3% of trades won.
Will STS signals have me trading all day?
No. In our hypothetical backtest the book took no trade on 42.7% of weekdays and exactly one on 38.4%, so 81.1% brought one trade or none. On 96.3% it took two or fewer, and its busiest day brought 4.
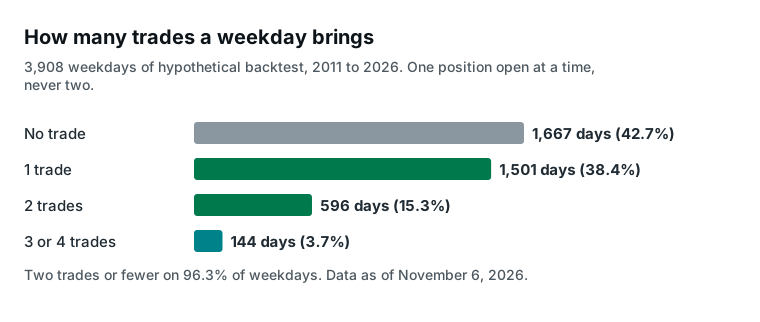
Over a week that adds up to about four: across 781 whole weeks the book averaged 4.02 trades a week, about 8 alert emails counting each entry and exit, and the median week brought 4.
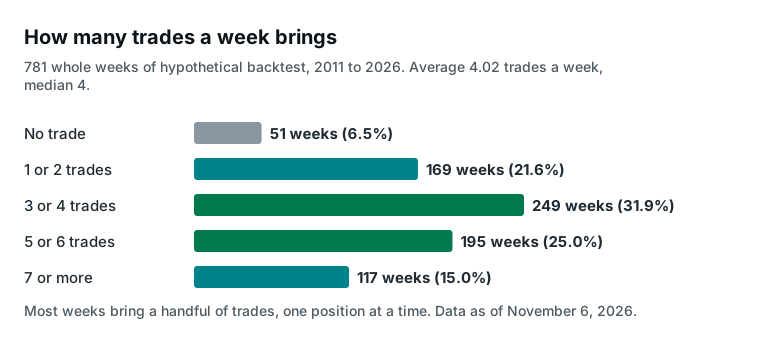
The week around each quarterly contract roll is quieter by design; how often NQ signals fire covers normal and quiet weeks in detail.
How does a small trade count help with overtrading?
It takes the "should I trade now?" decision off your plate, and it never stacks risk. Across all 3,139 backtest trades the book never had two positions open at once.
Every trade comes as a planned entry and a planned exit, each sent as its own alert. Between alerts there is nothing to chase and nothing to decide.
These are not scalps, trades held for seconds or a few minutes. The median day-session trade lasted 185 minutes, and 82.3% lasted 30 minutes or more, which leaves time to place each order calmly. If you keep your own cap on trades per day, a book that sends one trade or none on most days sits inside it easily.
Is each trade worth taking?
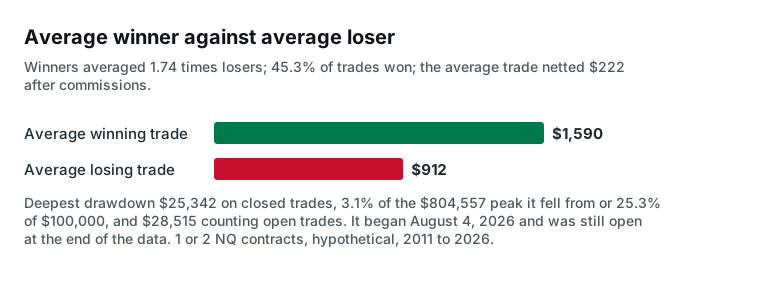
On average, yes. In the backtest the average winning trade made $1,590 and the average losing trade lost $912, so winners were 1.74 times losers while 45.3% of trades won.
The average backtest trade netted $222 after commissions, at 1 or 2 NQ contracts a trade. Over the same 2011 to 2026 backtest, the deepest drawdown, the largest fall from a previous high, was $25,342 on closed trades, 3.1% of the $804,557 peak it fell from or 25.3% of a fixed $100,000 account, and $28,515 counting open trades. It began on August 4, 2026 and was still open on November 6, 2026.
Each trade aims at a move worth far more than its cost. At $4.10 per contract, commissions took 3.1% of the book's profit before commissions. On MNQ, one tenth of an NQ contract, each point is worth a tenth as much.
How we measured this
Our four-strategy NQ book holds one position at a time and trades the NQ mini, 1 or 2 contracts a trade (2 when daily ranges are small, 1 when they are large; every trade since July 2024 has been 1 contract). These figures come from its TradingView backtest, 2011 to 2026 (data as of November 6, 2026): 3,139 trades with commissions and slippage included. All results are hypothetical.
The strategies follow momentum and trend, so the counts describe our book, not a rule for every trader. What carries over to your own trading is the habit: a small, fixed number of planned trades with planned exits.
We count trades by the trading day they entered, with a Sunday-evening entry counted toward Monday's session, over all 3,908 weekdays in the record, and by whole Monday-to-Friday weeks. An overlap would show as a trade entered before the previous one closed; there were none. Hold time runs from entry to exit for the 2,331 trades entered in the day session.
What this means for you
If you want a plan instead of a stream of setups, STS sends a few planned NQ trades a week, about four in our backtest, one at a time, each with its own exit alert. The signals come from four strategies, and you place every order yourself on your own platform. Membership is $50 a month or $500 a year, and you can cancel anytime; see pricing.
We trade this book live and sell access to the signals, so judge the data accordingly. This article is educational and is not investment advice. Futures trading involves substantial risk of loss and is not suitable for every investor.
Hypothetical Performance Disclaimer (CFTC Rule 4.41): These results are based on simulated or hypothetical performance results that have certain inherent limitations. Unlike the results shown in an actual performance record, these results do not represent actual trading. Also, because these trades have not actually been executed, these results may have under- or over-compensated for the impact, if any, of certain market factors, such as lack of liquidity. Simulated or hypothetical trading programs in general are also subject to the fact that they are designed with the benefit of hindsight. No representation is being made that any account will or is likely to achieve profits or losses similar to these being shown.
Past performance is not necessarily indicative of future results. Futures trading involves substantial risk of loss and is not suitable for all investors.
See what STS NQ futures signals are and how they reach you and our forward record, every live signal we have sent, dated and public.