EOD vs intraday trailing drawdown: same trades, different survival
Two funded accounts, same $2,000 buffer, same $50k size, same trades. One firm trails your drawdown on the end-of-day close. The other trails it on your intraday peak, counting open-trade gains you have not banked yet. We replayed the STS 15-year NQ and ES book under both rules. At three micros per signal, 8.4% of historical funding dates pass the end-of-day rule and blow up under the intraday rule, on the identical trade sequence.
The whole difference lives in the first 16 trades of a fresh account. After that the two rules are the same. The floor definition only bites while the account is at its most fragile, right after you fund it.
Whose trades these are, and what a discretionary trader takes from them
Every number here comes from our own book. Five systematic NQ and ES strategies, run as one single-position portfolio in TradingView backtests, 2011 to 2026, at one to three volatility-scaled contracts. The style is momentum and trend continuation, intraday plus one overnight model. Net $1,120,402 across 3,505 trades.
That style is the point. A momentum entry lets winners run and cuts losers short. So a winning trade often floats a big unrealized gain before it closes. The intraday floor ratchets up on that gain the instant it prints. An end-of-day floor never sees it. The gap between the two rules is a direct product of how far our trades travel in your favor before you book them.
If you trade discretionary, do not copy our exact percentages. Copy the method. Reconstruct your own intraday floor from your fills, look at how high your open trades float before you close them, and size the opening days so a single bad excursion cannot reach the floor.
The two rules are the same rule with one word changed
A trailing drawdown is a maximum-loss limit that follows your account's highest balance and never moves back down. On a $50k account it starts $2,000 below your balance, ratchets up as you make money, and locks at your starting balance once you have banked the $2,000 buffer. Touch it, even for a second intraday, and the account is closed. The only thing that differs between the two products is which "highest balance" the floor follows.
Apex splits this into two explicitly named accounts, effective March 1, 2026 (rules captured July 3, 2026). On the end-of-day product, the threshold is recalculated once per day at market close, on the closing balance. Apex's help center puts it plainly: the threshold "is calculated only once per day at market close based on the closing account balance." On the intraday product it moves in real time: "The Peak Balance includes both realized and unrealized gains. If an open trade pushes your account to a new high, the Trailing Threshold adjusts upward immediately even if the position is not closed."
For the $50k tier both products carry the same $2,000 drawdown. Same buffer, same trades, one word of difference in the floor definition. That is the whole experiment.
The intraday floor climbs on gains you never keep
Here is what that one word costs, on a fresh $50k account at 3x, walked forward through the first 17 trades our book took after 2011-06-26.
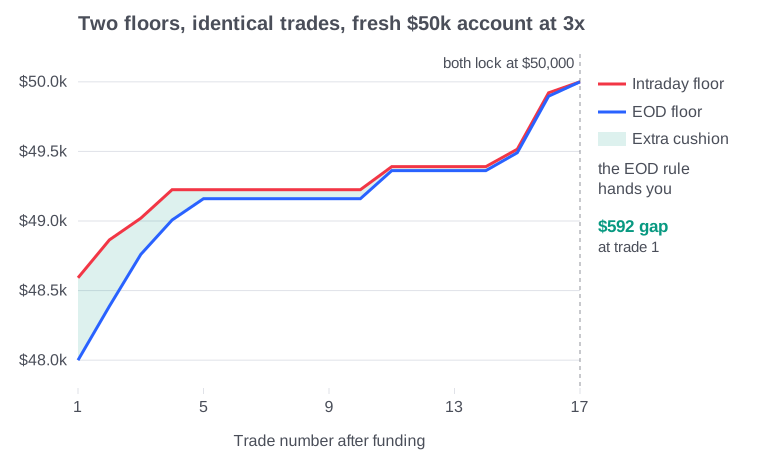
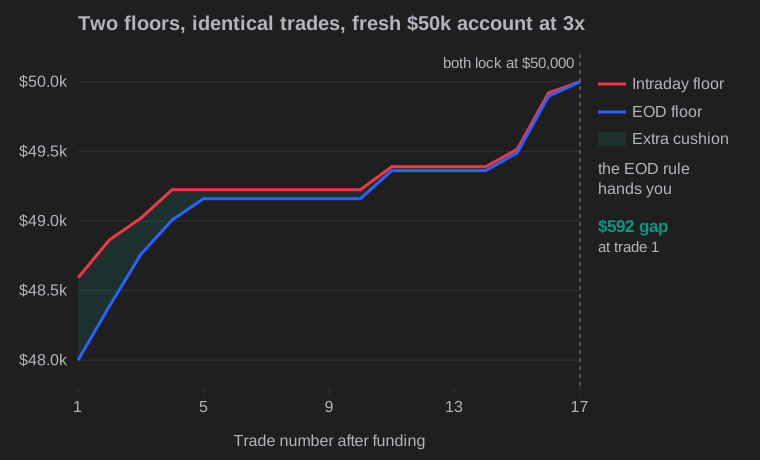
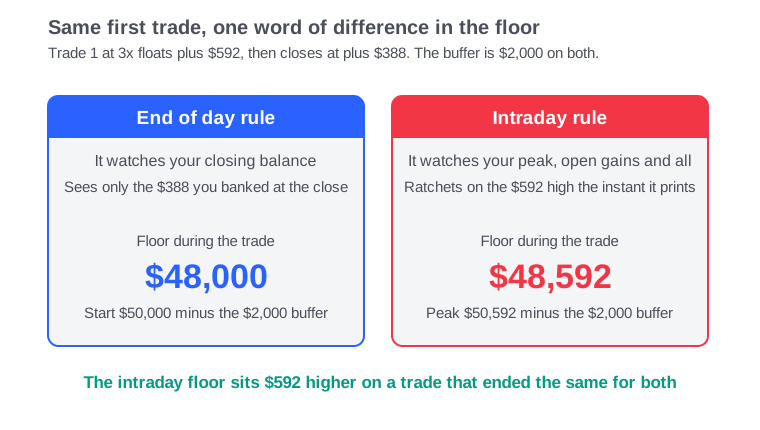
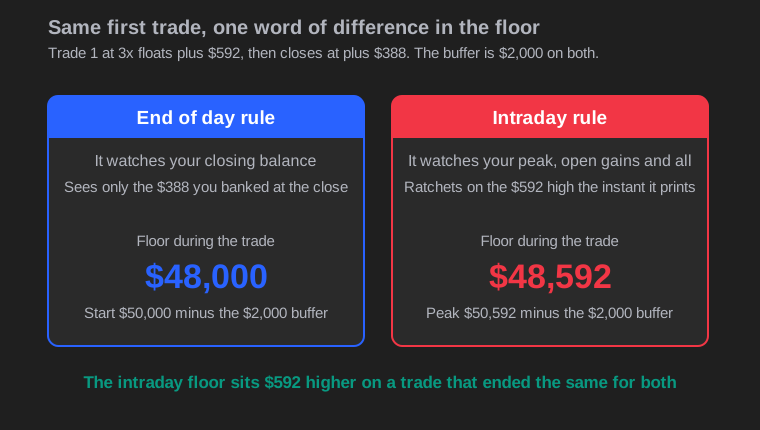
The very first trade opens the gap. It floated $592 of unrealized profit before it closed at $388. The intraday floor jumped to $48,592 on that peak. The end-of-day floor stayed at $48,000, because at the close the account was only up $388. The intraday account is now defending a floor $592 tighter, on a trade that ended the same for both. How wide that gap gets, and how long it lingers, depends entirely on size.
| Micros per signal | Intraday floor sits up to | EOD floor locks at trade | Intraday locks at trade |
|---|---|---|---|
| 1x (1 to 3 micros) | $286 higher | 1,207 | 1,203 |
| 2x (2 to 6 micros) | $501 higher | 828 | 807 |
| 3x (3 to 9 micros) | $592 higher | 17 | 16 |
Read the lock columns. At 3x the account banks its $2,000 buffer fast, so both floors lock by trade 17. At 1x it climbs so slowly the two floors stay apart for over a thousand trades, but the gap is small ($286). Bigger size opens a wider gap that closes sooner; smaller size opens a narrow gap that lingers.
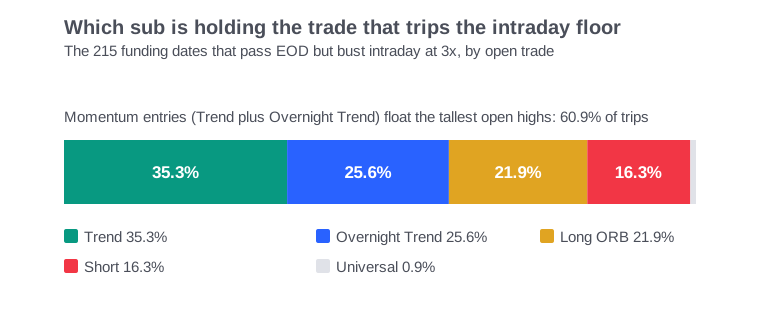
The trade that trips the wire is usually a momentum trade. We tagged every open position that breaches the intraday floor on a start date that would have cleared the end-of-day rule. At 3x our Trend sub is holding the position 35.3% of the time, and Overnight Trend another 25.6%. The two momentum-continuation models hold the tripping trade 60.9% of the time between them, against a 49.7% share of book trades and 47.0% of book MFE, so they are over-represented but not the whole story. Short is the clearest exception: it holds only 16.3% of the trips despite 23.9% of book MFE, so the plain "tallest highs trip the floor" reading is too clean. The honest version is that the intraday floor watches the open-trade high, and the subs that float the highest open highs most often, Trend and Overnight Trend, are the ones it catches most.
On the same trades, up to 8.4% of accounts survive one rule and die on the other
The floor gap only matters if it changes an outcome. So we tested every one of the 2,545 distinct trading days as a possible "day you funded the account and started taking signals." From each start we traded our real sequence forward until the account either cleared the $3,000 profit target or touched the floor. Same trades, both rulebooks. Then we counted the divergence: start dates that would have passed under the end-of-day rule but busted under the intraday rule.
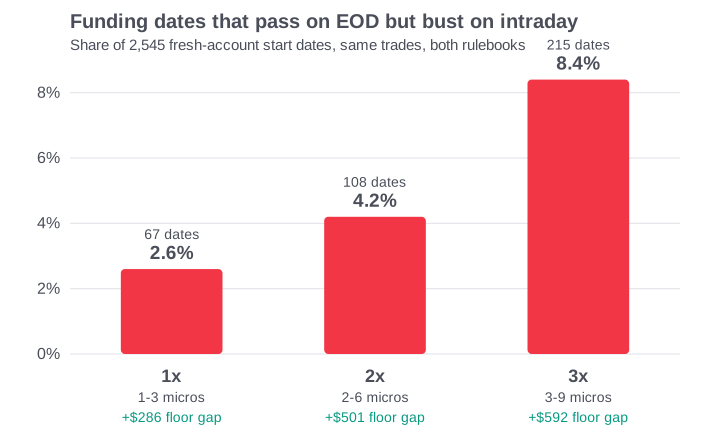
At 1x, 67 of 2,545 funding dates diverge (2.6%). At 2x, 108 (4.2%). At 3x, 215 (8.4%). The rate roughly doubles with each step up in size, for the same reason the floor gap widens: more contracts mean a taller open-trade excursion, and a taller excursion is exactly what the intraday floor punishes.
The reverse never happens. No funding date passes the intraday rule and busts on the end-of-day rule. It is impossible by construction: the intraday floor is always at or above the end-of-day floor, so the intraday account can only bust earlier or at the same moment, never later. The end-of-day rule is strictly the more forgiving of the two, at every size.
Read 8.4% as the historical frequency across overlapping starts, not an independent-trial probability. The 2,545 rolling starts are windows off one 3,505-trade sequence, so they share stretches: the 215 divergent 3x accounts bust on only 57 distinct days, and two of them (2016-01-19 and 2016-10-07) account for 40% of the whole set. Divergences also have to land next to the book's worst drawdowns by construction, since that is the only place a $2,000 floor gap can decide survival. So the clustering illustrates the mechanism rather than independently confirming it, which is exactly why we also report the reshuffled Monte-Carlo band below as the robustness check.
The 2x dates that split cluster on 2015-08-24 through 08-26, inside the book's worst 14-trade losing streak (2015-08-26 to 2015-09-30, down $7,412). The accounts that survive one rule and die on the other are the ones funded right before the genuinely bad stretch, exactly where you would expect the floor definition to decide the outcome.
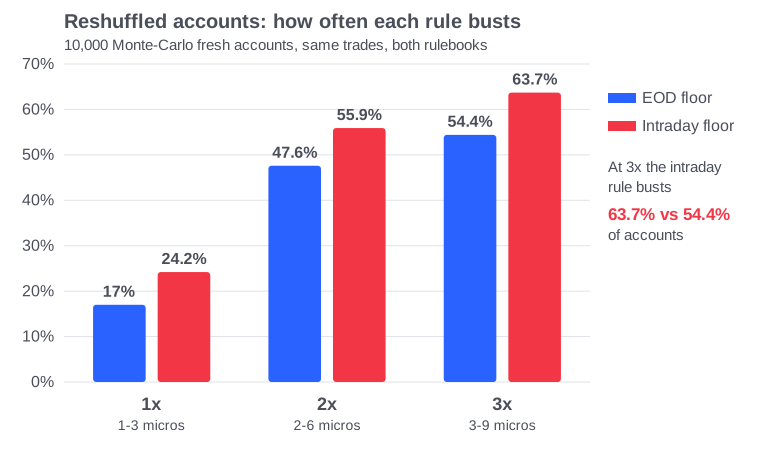
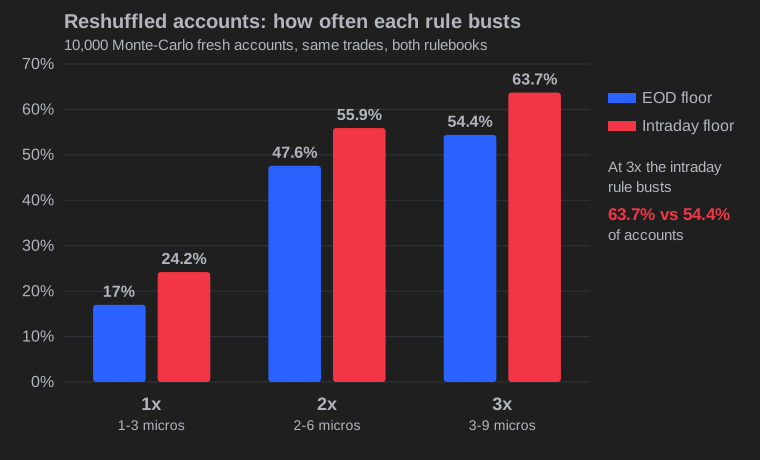
To check that this is not just the luck of one historical ordering, we reshuffled. A Monte-Carlo of 10,000 fresh accounts, resampling whole trading days with replacement to keep each day's intraday order intact (seed 20260703), put the pass-EOD-but-bust-intraday rate at 1.2% / 7.7% / 9.2% for 1x/2x/3x. At 3x the intraday floor busts 63.7% of accounts against 54.4% for the end-of-day floor. The realized figure (8.4% at 3x) and the reshuffled figure (9.2%) sit close and point the same way. Treat it as a range: around 8 to 9% of fresh accounts at 3x survive the end-of-day rule and die on the intraday rule, on our trades.
Nudge the fills and only the intraday floor breaks
Reshuffling the days removes the luck of one ordering. It does not test whether the exact fills matter. So we ran a second, harder check: keep the real sequence, and jitter every fill by a small random amount of noise. If the intraday gap were a fragile artifact of a few precise prices, small noise would erase it. If the gap is definitional, noise should break the intraday floor and leave the end-of-day floor almost untouched.
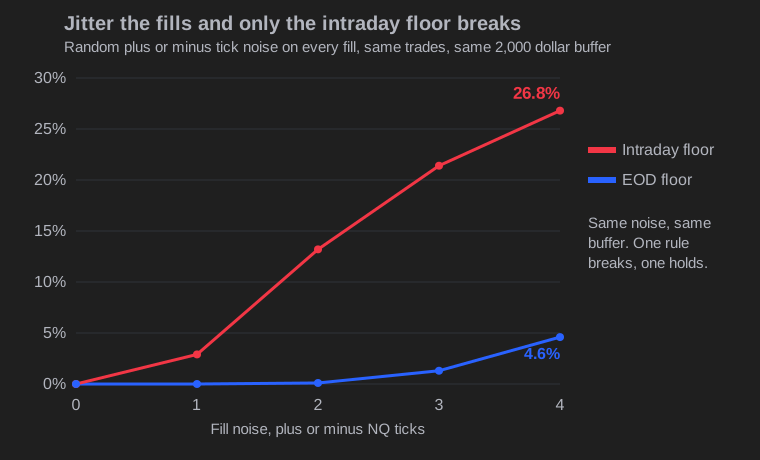
That is exactly what happens. On the full sequential book at one micro, with zero noise, neither $2,000 floor busts. Widen the noise and the intraday floor's bust rate climbs to 2.9%, 13.2%, 21.4%, and 26.8% at plus or minus one through four ticks. The end-of-day floor stays near zero the whole way, reaching just 4.6% at the widest noise. Same trades, same buffer, same noise on both. Only the floor definition differs.
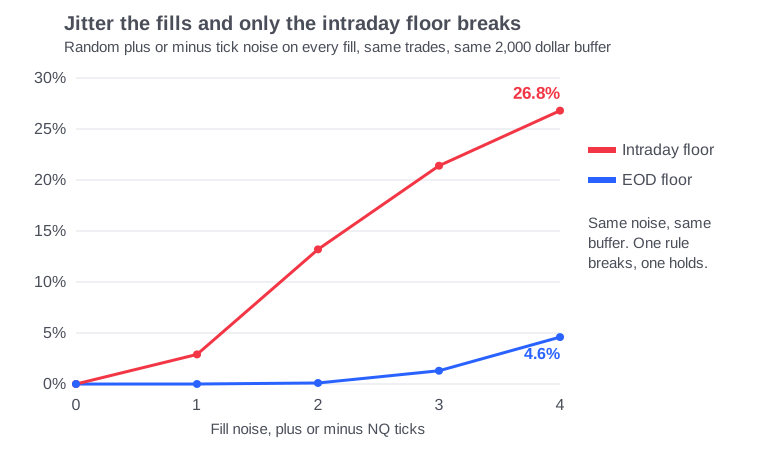
A floor that breaks five times more often than its twin under identical noise is not fragile by luck. It is fragile to the one thing it watches: the open-trade high. This is a stress test on the sequential one-micro book, a different lens from the 8.4% rolling-account headline, not a second estimate of it. And because our reconstructed intraday peak assumes an instant ratchet on the favorable excursion, it overstates the true peak, so 26.8% is if anything a floor on the real intraday fragility.
The one number that matters: when does the floor lock
You are exposed to the end-of-day versus intraday difference for exactly one stretch: until you have banked $2,000 of closed profit and the floor locks. Before that, size so a single bad open-trade excursion cannot drag your balance below:
start balance - $2,000 + (your worst-case open-trade loss)
At 1x our ramp survives both rules comfortably. Every extra micro roughly doubles the divergence rate, because it scales up the open-trade excursion the intraday floor watches. So on an intraday-trailing account, the cheap insurance is to trade the opening days small, bank the buffer, and only size up once the floor has locked. On an end-of-day account you have more room during the ramp, because the floor ignores your open-trade highs until the close. Same trades, and the safer size differs depending only on which rulebook you signed.
The sizing arithmetic is the same variance problem we walk through in why profitable traders fail prop firm combines: the floor tests the size of your drawdowns, not whether you make money. Picking the contract count is the other half, in how many points your NQ stop should be.
Where this model could be wrong, and which way it leans
We reconstruct the intraday floor from each trade's favorable excursion, and we assume the floor ratchets the instant the peak is touched, which is what Apex's intraday product states. A real data feed lags. So if anything, our model overstates the intraday peak and over-counts the intraday busts.
That cuts one way. Every intraday-harsher number here is a lower bound on the true gap, not a point estimate. The real intraday rule, with feed lag, is at worst exactly this punishing and probably a touch less. It is never more forgiving than the end-of-day rule.
This is a what-if on TradingView's exported trades, not an in-engine backtest of a rule change. We did not model Apex's daily loss limit, its consistency rule, or commissions beyond what the export already carries. It is the same reason a live drawdown almost always runs deeper than the backtest: reconstructed and forward numbers carry assumptions the raw backtest does not.
We are not affiliated with any prop firm named here. We use Apex's two products because they publish the cleanest side-by-side of the floor definitions. Prop rules change without notice; the rules here are dated to a July 3, 2026 capture and should be re-checked at the source before you act on them. TopStep states the same "floor rises on the end-of-day balance and never moves down" convention, but its sources disagree on whether the Combine ratchets intraday or at the close, so we do not use it for the quantitative comparison.
The floor definition is a sizing decision, not a footnote
The word you skim past on the account page decides 8% of fresh accounts at working size, and it decides all of them in the first 16 trades. If you are choosing between an end-of-day and an intraday product, the end-of-day rule is strictly the more survivable during the ramp, and the gap is worth real money exactly when your account has the least room. If you are already on an intraday product, the fix is not a better strategy. It is smaller size until the buffer is banked.
That points to the next thing we want to measure: the exact opening-day contract count that drops the intraday bust rate back down to the end-of-day rate. Our formula gives you the floor to stay above; the size that guarantees it is a function of your own worst-case excursion, and we will run that ramp explicitly in a follow-up.
The trades that produced these floors are the same ones on our tear sheet. If you want those signals in real time, that is the one thing we sell.
STS Research. Educational content, not investment advice. The 15-year record here is a TradingView backtest of our systematic book, not a live track record; we trade this book and sell access to its signals, so judge the data accordingly. We are not affiliated with Apex, TopStep, or any prop firm. Prop-firm rules are dated to a July 3, 2026 capture and change without notice.
CFTC Rule 4.41: Hypothetical or simulated performance results have certain limitations. Unlike an actual performance record, simulated results do not represent actual trading. Also, since the trades have not been executed, the results may have under- or over-compensated for the impact, if any, of certain market factors, such as lack of liquidity. Simulated trading programs in general are also subject to the fact that they are designed with the benefit of hindsight. No representation is being made that any account will or is likely to achieve profit or losses similar to those shown.
Past performance is not indicative of future results.