Does the NQ market open trend strategy actually work?
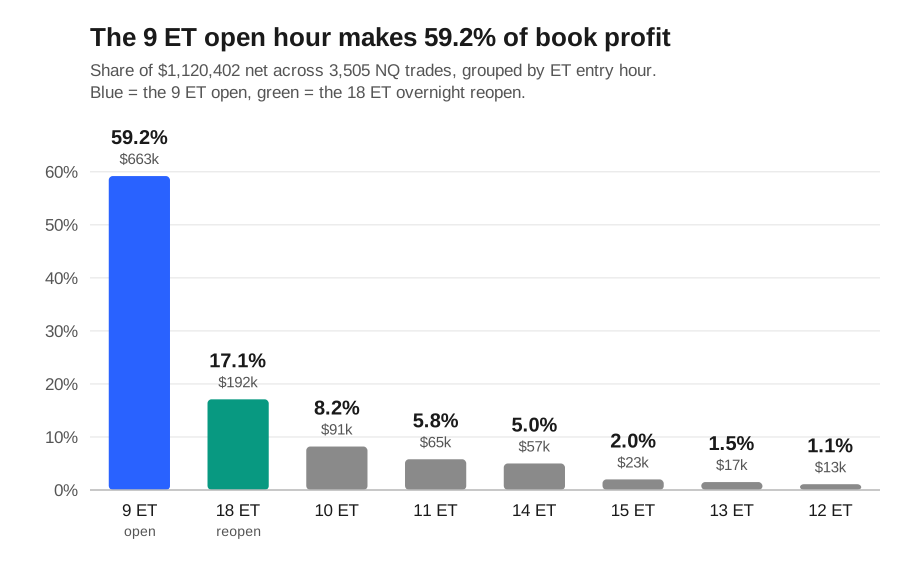
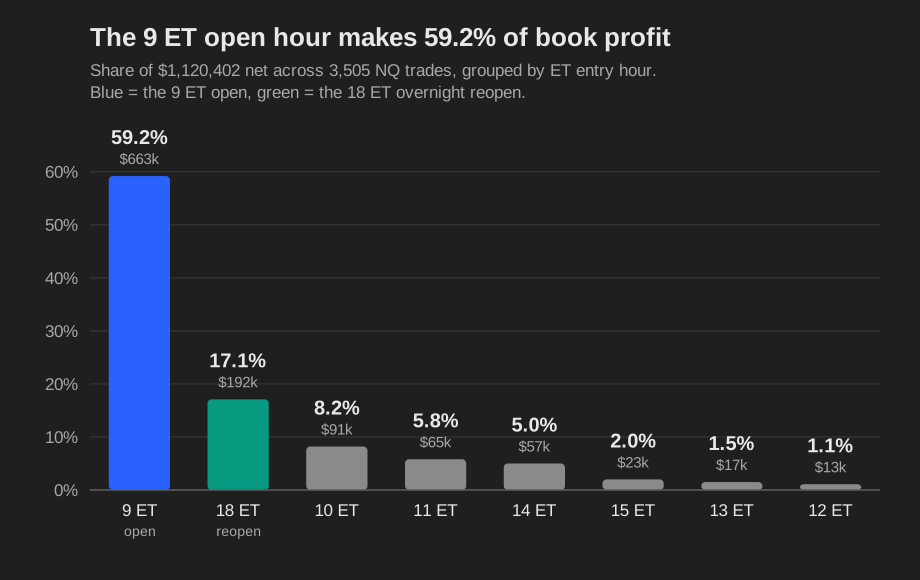
Yes, and it is the best hour on our book. On 3,500 backtested NQ trades since 2011, the 9 ET open hour made 60.1% of all book profit ($668,772 of $1,112,232). It did that at the lowest win rate of any hour, 38.4%. The open hour makes the most money by winning less than 4 times in 10 and letting the winners run.
That is the whole finding. The most profitable hour to trade the Nasdaq open is also the hardest hour to hold through.
The open hour towers over every other hour
Group all 3,500 book trades by the hour they entered. One hour dwarfs the rest.
| Entry hour (ET) | Trades | Net profit | Share of book | Win rate |
|---|---|---|---|---|
| 9 (open) | 1,595 | $668,772 | 60.1% | 38.4% |
| 18 (overnight) | 793 | $195,138 | 17.5 percent | 56.4% |
| 11 | 232 | $71,486 | 6.4% | 49.1% |
| 10 | 509 | $68,184 | 6.1% | 44.8% |
| 14 | 115 | $52,757 | 4.7% | 52.2% |
| 15 | 50 | $22,812 | 2.1% | 58.0% |
| 13 | 101 | $20,008 | 1.8% | 46.5% |
| 12 | 105 | $13,075 | 1.2% | 50.5% |
The 9 ET hour holds 1,595 trades and 60.1% of the profit. Add the overnight 18 ET bucket and the top two hours carry 77.7% of the book. Every row sums back to the full book, $1,112,232.40.
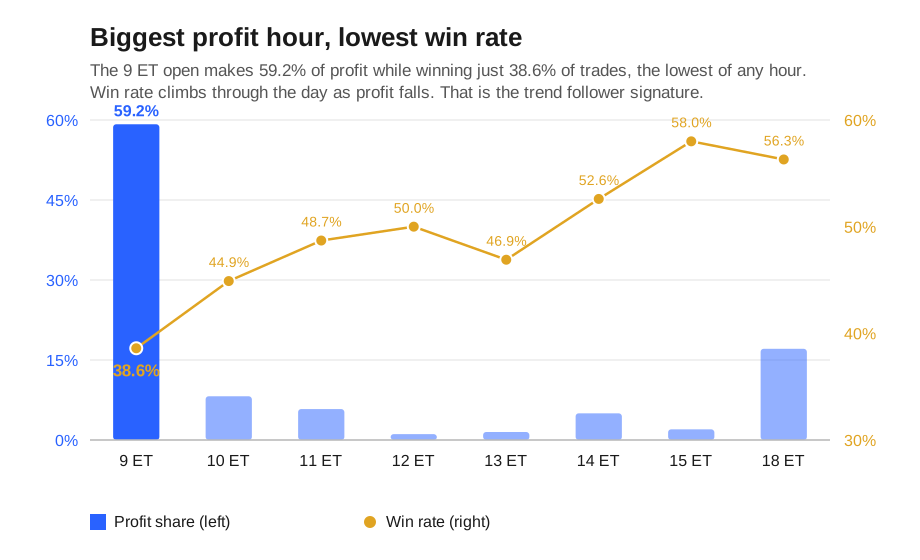
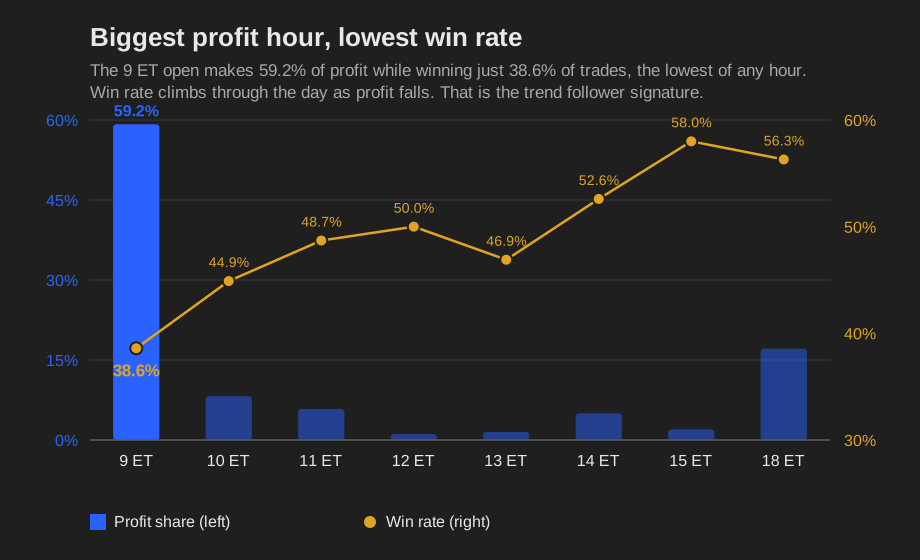
Now look at the win rate column. The open hour is not just the biggest. It is the worst at winning. Its 38.4% win rate is the lowest of any hour. The next lowest, 10 ET, sits at 44.8%. Every other hour wins more often and makes less money.
One caveat on that 38.4%. It is a blended rate across the subs that fire in the hour, not the win rate of a single strategy. Segregated, the trend sub wins 33.8% in the open hour, the short sub 40.1%, and the long opening-range breakout 47.7%. So the low blended rate is driven by the high-count trend sub, not by "the open" as an abstract property. The trend workhorse is the true low-win-rate, high-payoff engine, and it dominates the hour by trade count, which pulls the blend down to 38.4%.
That is the trend-following signature. Losses are cut short and winners are allowed to run. At the open the average winner is $2,870 and the average loser is $1,110, a payoff of 2.59 to 1. So a hitter that misses six of ten still wins the game on size. By contrast the 18 ET overnight hour wins 56.4% but pays only 1.22 to 1.
The entries land right after the 9:30 cash open
The "9 ET hour" is not vague. The entries cluster at 9:40, 9:45, 9:50, and 9:55, right after the 9:30 New York cash open. That 9:30 ET bell is the regular-session open for the Nasdaq-100 cash index, the same moment CME sets the reference for NQ futures, and it is the daily liquidity and volatility event these entries key off. We confirmed the minutes with a timezone check on the export. The 18:xx bucket is our overnight strategy, a separate animal.
So when we say "the open," we mean the first 25 minutes of the U.S. equity session, after the opening range has formed.
Whose trades are these
This is one backtested NQ book, not a textbook. It is a 6 strategy family sharing a single position, backtested on TradingView from 2011 to 2026 at 1 to 3 volatility-scaled contracts. In the combined book only 5 of the 6 subs actually place trades. The short opening-range breakout (S-ORB) fires zero trades in the combined book. It is contended out at the shared position, so the working lineup is 5 active subs: intraday trend, long opening-range breakout, short, overnight trend, and universal.
Every strategy is a momentum or trend-continuation entry. Intraday trend, opening-range breakout, and one overnight sub. None of them are mean reversion. None are scalps.
That matters for how you read this. "The open hour is the low-win-rate workhorse" is a property of momentum entries on NQ. A mean-reversion book would show a different hour geometry. Do not treat our hour map as a universal law of markets. It is what our backtested trades did.
The long opening-range breakout is the open-hour standout
One strategy stands out in the open hour: the long opening-range breakout, which we call L-ORB. It fires the second-most trades in the hour, behind the high-count trend sub, but wins far more often. On its own, as a standalone backtest through June 2026, here is its full tear sheet.
| Metric | L-ORB standalone |
|---|---|
| Trades | 1,653 |
| Net profit | $284,206 |
| Win rate | 49.8% |
| Profit factor (gross wins / gross losses) | 1.32 |
| Per-trade t-stat | 2.92 |
| Max drawdown | $33,765 (11.6% of its normalized capital base) |
| Max consecutive losses | 14 |
| Rolling 4-year profit factor | 1.01 to 1.51 |
| Positive years | 12 of 16 |
L-ORB is itself open-heavy. 43.6% of its net comes from the 9 ET hour and another 24.1% from 10 ET. Buy the breakout of the opening range, hold the runners, and the morning pays the bill.
The $33,765 max drawdown is exact. The 11.6% figure is that dollar drawdown against L-ORB's normalized capital base, not against peak equity. On its own equity curve the same drawdown is 17.7% of peak and 11.9% of final equity. We flag the denominator so the percentage is not read as a peak-to-trough equity drop.
But L-ORB is not who owns the open-hour dollars
Here is the twist. L-ORB has the most trades, but it does not own the open hour's profit.
Split the 9 ET hour's $668,772 by strategy. The trend sub (S1) owns 49.0% of it. The short sub (S3) owns 32.9%. L-ORB owns only 15.6% of the hour's dollars.
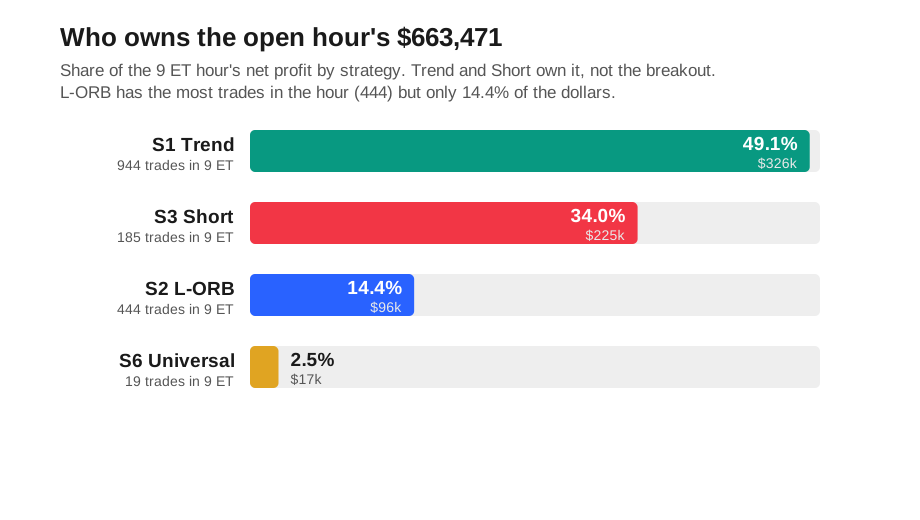
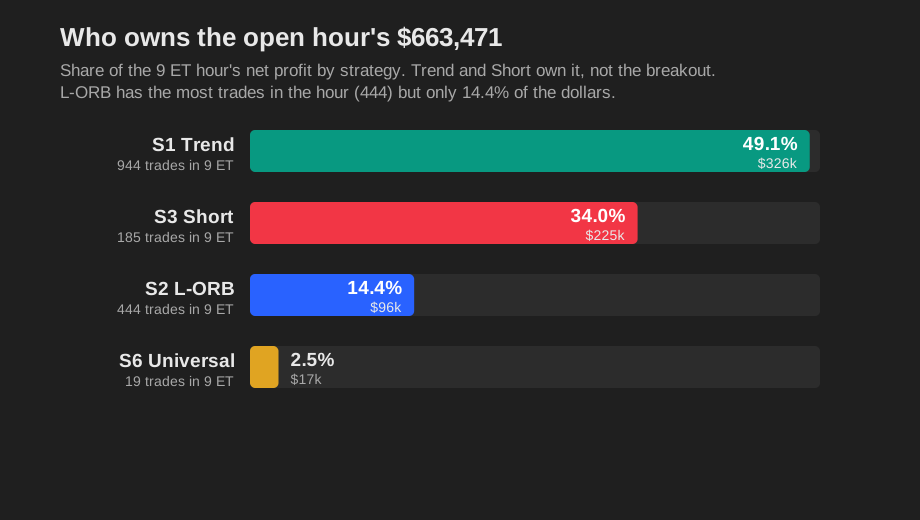
L-ORB is big by count. It is not the biggest by open-hour profit. The trend and short entries land fewer trades in that hour but carry bigger runners. If you want the money at the open, you need trend continuation and you need to be willing to go short, not just buy the range break.
How the edge holds up
We resampled the open-hour profit stream to see if 60.1% is a fluke of one path.
Using a moving-block bootstrap (5,000 resamples, block length 20, so losing streaks stay intact), 100% of the resampled open-hour paths came out net positive. Even the 2.5th-percentile path, the weakest tail, still kept about $446,000 of open-hour profit.
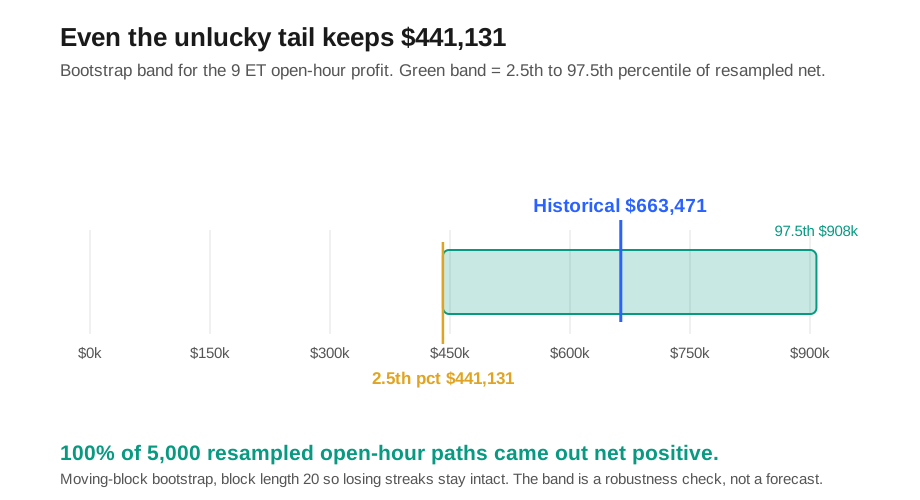
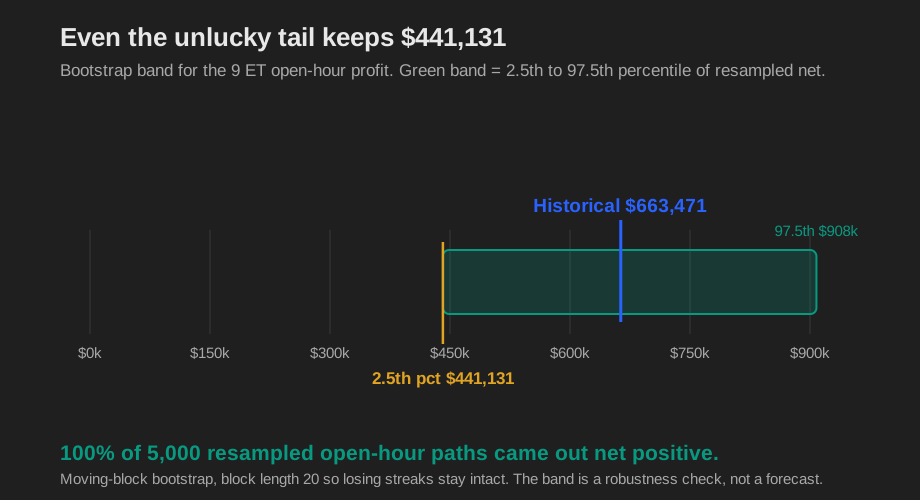
The headline number stays the historical point estimate, $668,772. The bootstrap is only a robustness band, not a forecast. We never publish the resample mean.
Read the "100% positive" honestly. This is an in-sample moving-block resample of one historical path, so it measures how fragile the result is to the ordering and clustering of the trades we already have. It is not an out-of-sample test and it is not evidence of forward edge. For a stream with a 2.59 payoff and a large positive mean, a high positive share is close to expected, so treat it as a fragility check only. The out-of-sample question, whether the low win rate and the payoff hold on months outside our regime map, is the one we flag as open below.
Methodology
- Instrument: NQ (E-mini Nasdaq-100 futures), CME. NQ and ES only.
- Data and window: our own TradingView backtest, 3,500 trades, 2011 to 2026, data as of August 5, 2026.
- Costs and fills: the backtest inherits TradingView's fill model and our commission and slippage assumptions. This is a what-if grouping of the backtested trades by entry hour, not a fresh in-engine backtest of a "trade only the open" rule.
- Sizing: 1 to 3 contracts, volatility-scaled, single shared position across the 6 sub family. 5 subs place trades in the book; the short opening-range breakout sub is contended out and fires zero trades.
- Book reconciliation: the grouped hours sum back to the canonical book, 3,500 trades, $1,112,232.40 net, 45.5% win rate, 1.55 profit factor.
- What would falsify this: if the open-hour share fell well below 60% on fresh data, or if the 9 ET win rate climbed above the other hours, the "low-WR workhorse" claim breaks.
The honest limits
A 38.4% win rate is brutal to hold through. Six or seven losers in a row are normal here. L-ORB's worst streak was 14 straight losses, and we published the book's worst losing streak in full so nobody has to guess at it. Most discretionary traders quit the exact hour that pays them.
The per-hour cells past the open get thin. The noon hour (12 ET) has 105 trades, the 3 PM ET hour (15 ET) only 50. Do not lean on any single small hour. Only the 9 ET and 18 ET buckets are large enough to trust hard.
Our regime map only runs through May 2025, so 239 recent trades sit outside it. The regime read is a robustness check, not a headline.
Try it on your own tape
You do not need our data to see this. Take your own NQ trade log and do one thing. Add a column for the entry hour in ET, then sum profit and win rate per hour.
per-hour = group your fills by ET entry hour
for each hour: sum(net_pnl), count(trades), wins/trades
sort hours by total profit, descending
If your book is momentum-based, the open hour will likely sit at the top for profit and near the bottom for win rate. If it does, the question is not whether to trade the open. It is whether you can sit through the win rate that pays you.
What we test next
We want to know two things. First, whether a discretionary trader can capture the open-hour edge without sitting through the full 38.4%-win-rate tape, maybe by only taking the trend and short entries that own the hour. Second, whether that low win rate stays stable across the newest months that fall outside our regime map. If the open hour ever starts winning more than 45% of the time, something has changed, and we will say so.
See how the hours fit together in our best time to trade NQ futures breakdown, why the low win rate needs room in how many points an NQ stop-loss should be, the full lineup on our strategies, and access details on pricing.
Conflict disclosure: We trade this NQ book live and we sell access to the signals. Judge the data on its merits and reproduce it yourself.
CFTC Rule 4.41: Hypothetical or simulated performance results have certain limitations. Unlike an actual performance record, simulated results do not represent actual trading. Also, because the trades have not actually been executed, the results may have under- or over-compensated for the impact, if any, of certain market factors, such as lack of liquidity. Simulated trading programs in general are also subject to the fact that they are designed with the benefit of hindsight. No representation is being made that any account will or is likely to achieve profit or losses similar to those shown.
Past performance is not indicative of future results.