How often does NQ set its high or low of the day in the first hour?
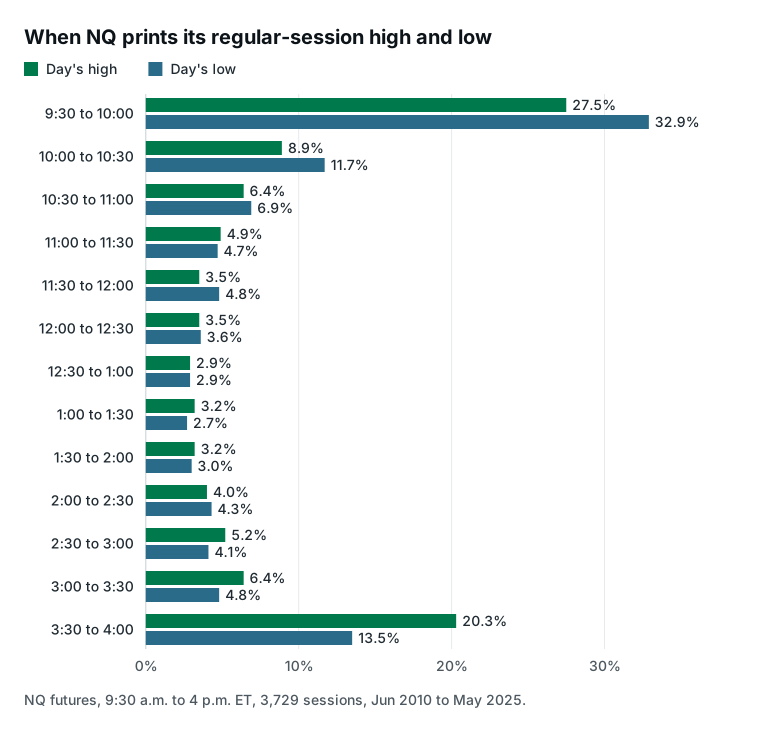
Short answer. In 76.8% of 3,729 NQ regular sessions from June 2010 to May 2025, the day's high or low was set in the first hour, 9:30 to 10:30 a.m. ET. The low landed there on 44.6% of sessions and the high on 36.3%; both did on 4.1%.
Here "the day" means the regular session, 9:30 a.m. to 4 p.m. ET, and its high and low ignore the overnight session.
How steady is the first-hour rate?
Very. The share of sessions with a high or low in the first hour was 77.0%, 76.9% and 76.6% across the three five-year eras.
| Where the day's high or low printed | All sessions (3,729) | 2010 to 2014 (1,133) | 2015 to 2019 (1,247) | 2020 to 2025 (1,349) |
|---|---|---|---|---|
| High in the first hour | 36.3% | 36.9% | 36.3% | 35.9% |
| Low in the first hour | 44.6% | 45.6% | 45.0% | 43.4% |
| High or low in the first hour | 76.8% | 77.0% | 76.9% | 76.6% |
| High or low in the first 30 minutes | 59.8% | 58.5% | 60.3% | 60.5% |
| High or low in the last 30 minutes | 33.8% | 29.8% | 32.2% | 38.6% |
| Neither first hour nor last 30 minutes | 11.7% | 12.9% | 11.5% | 11.0% |
Each cell is a share of the sessions in its column. First hour = 9:30 to 10:30 a.m. ET; last 30 minutes = 3:30 to 4 p.m. ET.
The close has been gaining. The share of sessions with a high or low in the last 30 minutes rose from 29.8% of 1,133 in 2010 to 2014 to 38.6% of 1,349 in 2020 to 2025, while the first-hour share held.
Is this more than chance?
Partly it is how prices move. A random path with no time-of-day pattern puts its high or low in the first hour about half the time (52.5% in a 200,000-path simulation), because a random path's extremes tend to sit near its ends. The open is also NQ's busiest stretch: the first hour, 15.4% of the session's time, carried 30.4% of its five-minute price variance. A random path with that same volatility profile reaches 70.5%. NQ's actual 76.8% is higher still.
The same holds for how much of the day's range the first hour covers. On the median session it was 59.6% (58.5% to 60.5% by era), against 49.4% for that random path.
Midday rarely set either extreme. From 11:30 a.m. to 2 p.m., each half hour held the day's high on 2.9% to 3.5% of sessions and the day's low on 2.7% to 4.8%.
What happened on up and down days?
Looking back after the close, the first hour held the low on 71.8% of the 2,020 sessions that closed above their open, and the high on 68.9% of the 1,699 that closed below it. That direction is only known at 4 p.m., so it describes the day after the fact; it is not a signal at 10:30.
These are past frequencies, not a forecast for any single session.
How we measured this
- CME NQ futures 5-minute bars, front month and not back-adjusted, 3,729 sessions (9:30 a.m. to 4 p.m. ET, at most 3 bars missing) from June 3, 2010 to May 30, 2025; half days dropped.
- The high (low) is placed in the first five-minute bar that printed it; the first hour is the twelve bars from 9:30 to 10:30 a.m., and the 9:30 open counts.
- Benchmarks: 200,000 simulated 78-step paths starting at the open, with equal steps or with NQ's average volatility for each five-minute slot.
For how big a normal NQ session is, see NQ and ES average daily range.
For how often the gap from the prior close fills the same day, see how often NQ gaps fill.
STS Futures sends systematic NQ futures signals; see how they work.