How often do NQ gaps fill the same day?
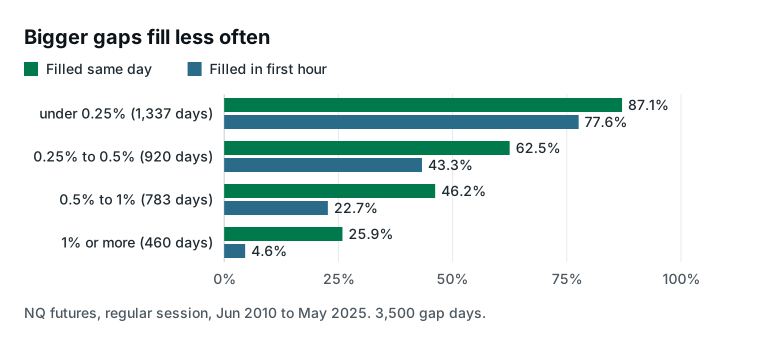
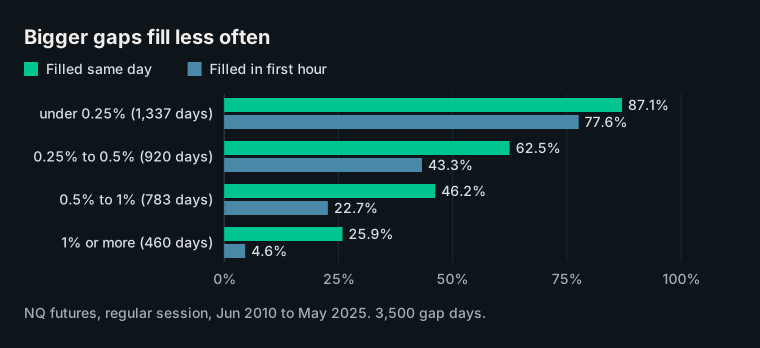
Short answer. Across 3,500 NQ sessions from June 2010 to May 2025, 63.5% of regular-session gaps traded back to the prior 4 p.m. ET close the same day. Size decides it: 87.1% of gaps under 0.25% filled, against 25.9% of gaps of 1% or more.
NQ trades nearly around the clock, so the gap traders mean is the distance between the prior regular-session close at 4 p.m. ET and the 9:30 a.m. ET open. It fills when price trades back to that close before 4 p.m. the same day.
How does gap size change the fill rate?
The bigger the gap, the less often it filled, and the order held in all three five-year eras.
| Gap size (share of 3,500 days) | Filled same day | Filled by 10:30 a.m. | 2010 to 2014 | 2015 to 2019 | 2020 to 2025 |
|---|---|---|---|---|---|
| Under 0.25% (38.2%) | 87.1% of 1,337 | 77.6% | 88.1% of 436 | 84.9% of 502 | 89.0% of 399 |
| 0.25% to 0.5% (26.3%) | 62.5% of 920 | 43.3% | 62.0% of 300 | 56.9% of 320 | 69.0% of 300 |
| 0.5% to 1% (22.4%) | 46.2% of 783 | 22.7% | 46.0% of 211 | 39.5% of 243 | 51.4% of 329 |
| 1% or more (13.1%) | 25.9% of 460 | 4.6% | 23.1% of 104 | 26.4% of 110 | 26.8% of 246 |
| All gaps | 63.5% of 3,500 | 46.7% | 65.7% of 1,051 | 62.4% of 1,175 | 62.6% of 1,274 |
Era columns show the same-day fill rate. "Filled by 10:30 a.m." is a share of every gap in that row.
At an NQ price of 20,000, 0.25% is 50 points and 1% is 200. The median gap was 0.35%, about 70 points.
The two extremes were steady: gaps under 0.25% filled 84.9% to 89.0% of the time in every era, and gaps of 1% or more 23.1% to 26.8%. The middle sizes moved by up to 12 points: gaps of 0.25% to 0.5% filled 56.9% of the time in 2015 to 2019 and 69.0% in 2020 to 2025.
Is a fill special, or just a nearby price?
Mostly it is distance. A level the same distance beyond the open, in the gap's direction, was reached the same day 59.9% of the time, against 63.5% for the fill. The fill was reached more often in 11 of the 12 era-and-size cells, by up to 10 points; the exception was gaps of 1% or more in 2010 to 2014, a tie (23.1% filled, 23.1% extended).
When in the day do gaps fill, and in which direction?
Of the 1,165 gaps under 0.25% that filled, 89.1% filled by 10:30 a.m. Of the 119 gaps of 1% or more that filled, 17.6% did.
Gaps down filled slightly more often: 65.7% of 1,527, against 61.7% of 1,973 gaps up, and more often in all four size bands, by 0.3 to 7.2 points.
These are frequencies, not a rule: a 25.9% fill rate for gaps of 1% or more also means 74.1% of them did not fill that day. They describe past behaviour, not a forecast.
How we measured this
- CME NQ futures 5-minute bars, front month and not back-adjusted, 3,729 sessions (9:30 a.m. to 4 p.m. ET, at most 3 bars missing) from June 3, 2010 to May 30, 2025; half days dropped.
- Gap = 9:30 a.m. open against the prior trading day's 4 p.m. close, with the prior trading day taken from the NYSE calendar (a market holiday counts like a weekend); filled = traded at or through that close by 4 p.m.
- Dropped: 180 sessions near quarterly contract rolls, where the prior close can sit on another contract; 38 whose prior trading day is not a complete session in the data (31 after half days, 3 after sessions with more than 3 bars missing, the first day of the file, and 3 whose prior trading day is missing from the data entirely: December 30, 2013, February 3, 2014 and October 26, 2020); 11 opening exactly at the prior close.
For how the overnight session sets the levels the open reacts to, see how to read the NQ and ES daily bias.
For how often the day's high or low is set in the first hour, see how often NQ sets its high or low in the first hour.
STS Futures sends systematic NQ futures signals; see how they work.